Immigrants from Western Africa vs Swiss Unemployment Among Ages 60 to 64 years
COMPARE
Immigrants from Western Africa
Swiss
Unemployment Among Ages 60 to 64 years
Unemployment Among Ages 60 to 64 years Comparison
Immigrants from Western Africa
Swiss
4.9%
UNEMPLOYMENT AMONG AGES 60 TO 64 YEARS
20.6/ 100
METRIC RATING
202nd/ 347
METRIC RANK
4.6%
UNEMPLOYMENT AMONG AGES 60 TO 64 YEARS
99.8/ 100
METRIC RATING
59th/ 347
METRIC RANK
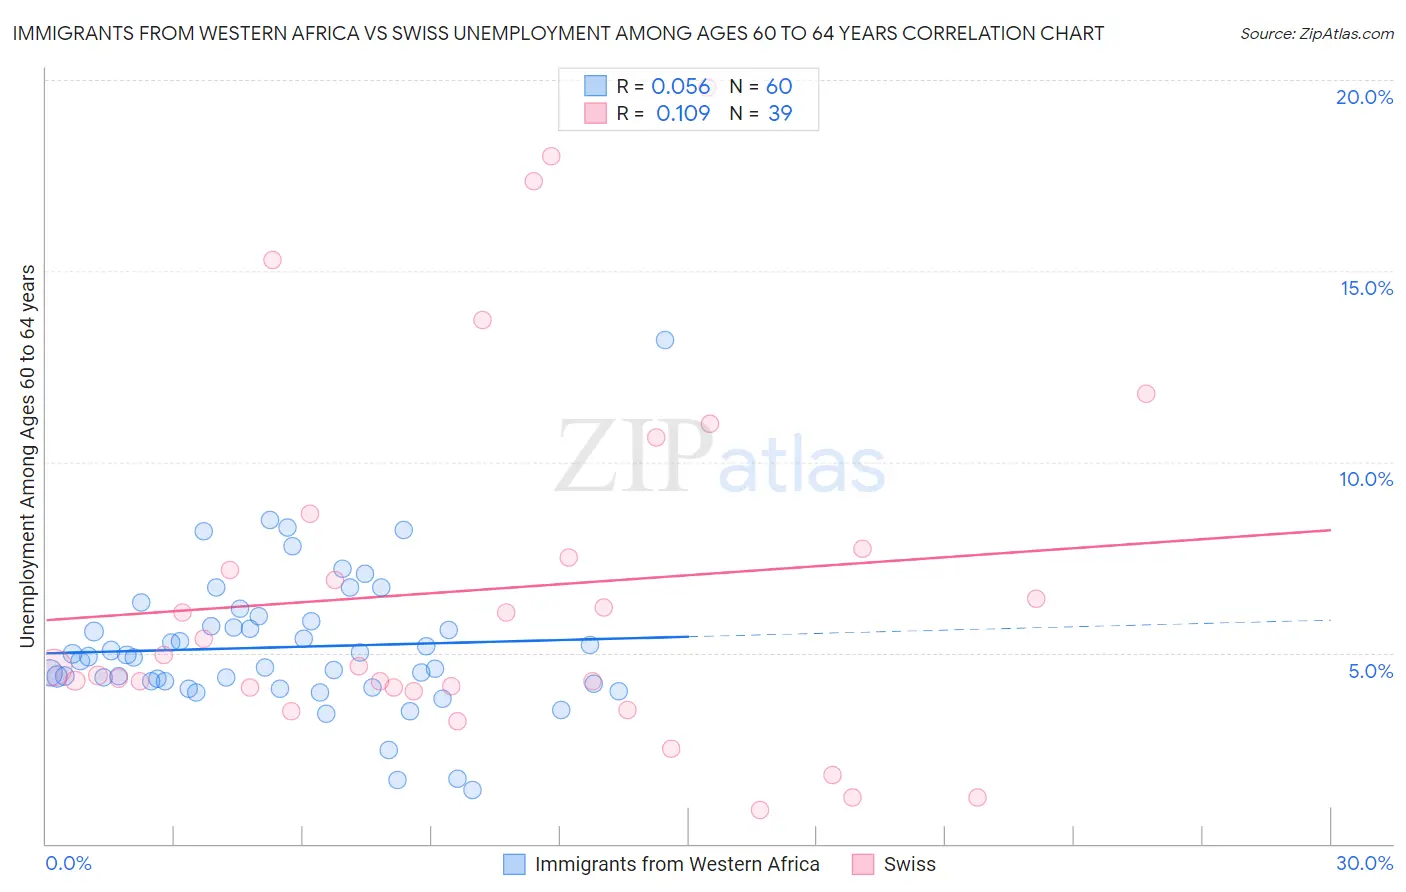
Immigrants from Western Africa vs Swiss Unemployment Among Ages 60 to 64 years Correlation Chart
The statistical analysis conducted on geographies consisting of 328,663,642 people shows a slight positive correlation between the proportion of Immigrants from Western Africa and unemployment rate among population between the ages 60 and 64 in the United States with a correlation coefficient (R) of 0.056 and weighted average of 4.9%. Similarly, the statistical analysis conducted on geographies consisting of 401,314,393 people shows a poor positive correlation between the proportion of Swiss and unemployment rate among population between the ages 60 and 64 in the United States with a correlation coefficient (R) of 0.109 and weighted average of 4.6%, a difference of 7.2%.
Unemployment Among Ages 60 to 64 years Correlation Summary
| Measurement | Immigrants from Western Africa | Swiss |
| Minimum | 1.4% | 0.90% |
| Maximum | 13.2% | 19.8% |
| Range | 11.8% | 18.9% |
| Mean | 5.1% | 6.7% |
| Median | 4.9% | 4.7% |
| Interquartile 25% (IQ1) | 4.2% | 4.1% |
| Interquartile 75% (IQ3) | 5.8% | 7.7% |
| Interquartile Range (IQR) | 1.5% | 3.6% |
| Standard Deviation (Sample) | 1.9% | 4.7% |
| Standard Deviation (Population) | 1.8% | 4.7% |
Similar Demographics by Unemployment Among Ages 60 to 64 years
Demographics Similar to Immigrants from Western Africa by Unemployment Among Ages 60 to 64 years
In terms of unemployment among ages 60 to 64 years, the demographic groups most similar to Immigrants from Western Africa are Uruguayan (4.9%, a difference of 0.040%), Colombian (4.9%, a difference of 0.10%), Russian (4.9%, a difference of 0.10%), Immigrants from Czechoslovakia (4.9%, a difference of 0.15%), and Guamanian/Chamorro (4.9%, a difference of 0.16%).
| Demographics | Rating | Rank | Unemployment Among Ages 60 to 64 years |
| Immigrants | Austria | 26.6 /100 | #195 | Fair 4.9% |
| Immigrants | Asia | 25.7 /100 | #196 | Fair 4.9% |
| Immigrants | Eastern Europe | 25.2 /100 | #197 | Fair 4.9% |
| Guamanians/Chamorros | 23.7 /100 | #198 | Fair 4.9% |
| Immigrants | Vietnam | 23.7 /100 | #199 | Fair 4.9% |
| Immigrants | Czechoslovakia | 23.5 /100 | #200 | Fair 4.9% |
| Colombians | 22.7 /100 | #201 | Fair 4.9% |
| Immigrants | Western Africa | 20.6 /100 | #202 | Fair 4.9% |
| Uruguayans | 19.9 /100 | #203 | Poor 4.9% |
| Russians | 18.9 /100 | #204 | Poor 4.9% |
| Immigrants | Indonesia | 17.4 /100 | #205 | Poor 4.9% |
| New Zealanders | 17.4 /100 | #206 | Poor 4.9% |
| Chippewa | 17.3 /100 | #207 | Poor 4.9% |
| German Russians | 16.8 /100 | #208 | Poor 4.9% |
| Sierra Leoneans | 16.5 /100 | #209 | Poor 4.9% |
Demographics Similar to Swiss by Unemployment Among Ages 60 to 64 years
In terms of unemployment among ages 60 to 64 years, the demographic groups most similar to Swiss are Puget Sound Salish (4.6%, a difference of 0.020%), Immigrants from India (4.6%, a difference of 0.10%), British (4.6%, a difference of 0.15%), Welsh (4.6%, a difference of 0.16%), and Bangladeshi (4.6%, a difference of 0.25%).
| Demographics | Rating | Rank | Unemployment Among Ages 60 to 64 years |
| Kenyans | 99.9 /100 | #52 | Exceptional 4.6% |
| Immigrants | Moldova | 99.9 /100 | #53 | Exceptional 4.6% |
| Dutch | 99.9 /100 | #54 | Exceptional 4.6% |
| Bangladeshis | 99.9 /100 | #55 | Exceptional 4.6% |
| Welsh | 99.9 /100 | #56 | Exceptional 4.6% |
| British | 99.9 /100 | #57 | Exceptional 4.6% |
| Immigrants | India | 99.8 /100 | #58 | Exceptional 4.6% |
| Swiss | 99.8 /100 | #59 | Exceptional 4.6% |
| Puget Sound Salish | 99.8 /100 | #60 | Exceptional 4.6% |
| Lebanese | 99.8 /100 | #61 | Exceptional 4.6% |
| Senegalese | 99.7 /100 | #62 | Exceptional 4.6% |
| Czechoslovakians | 99.7 /100 | #63 | Exceptional 4.6% |
| Immigrants | Middle Africa | 99.7 /100 | #64 | Exceptional 4.6% |
| Jordanians | 99.7 /100 | #65 | Exceptional 4.6% |
| Hawaiians | 99.6 /100 | #66 | Exceptional 4.6% |