Immigrants from Grenada vs Swiss 4th Grade
COMPARE
Immigrants from Grenada
Swiss
4th Grade
4th Grade Comparison
Immigrants from Grenada
Swiss
96.7%
4TH GRADE
0.0/ 100
METRIC RATING
291st/ 347
METRIC RANK
98.2%
4TH GRADE
100.0/ 100
METRIC RATING
33rd/ 347
METRIC RANK
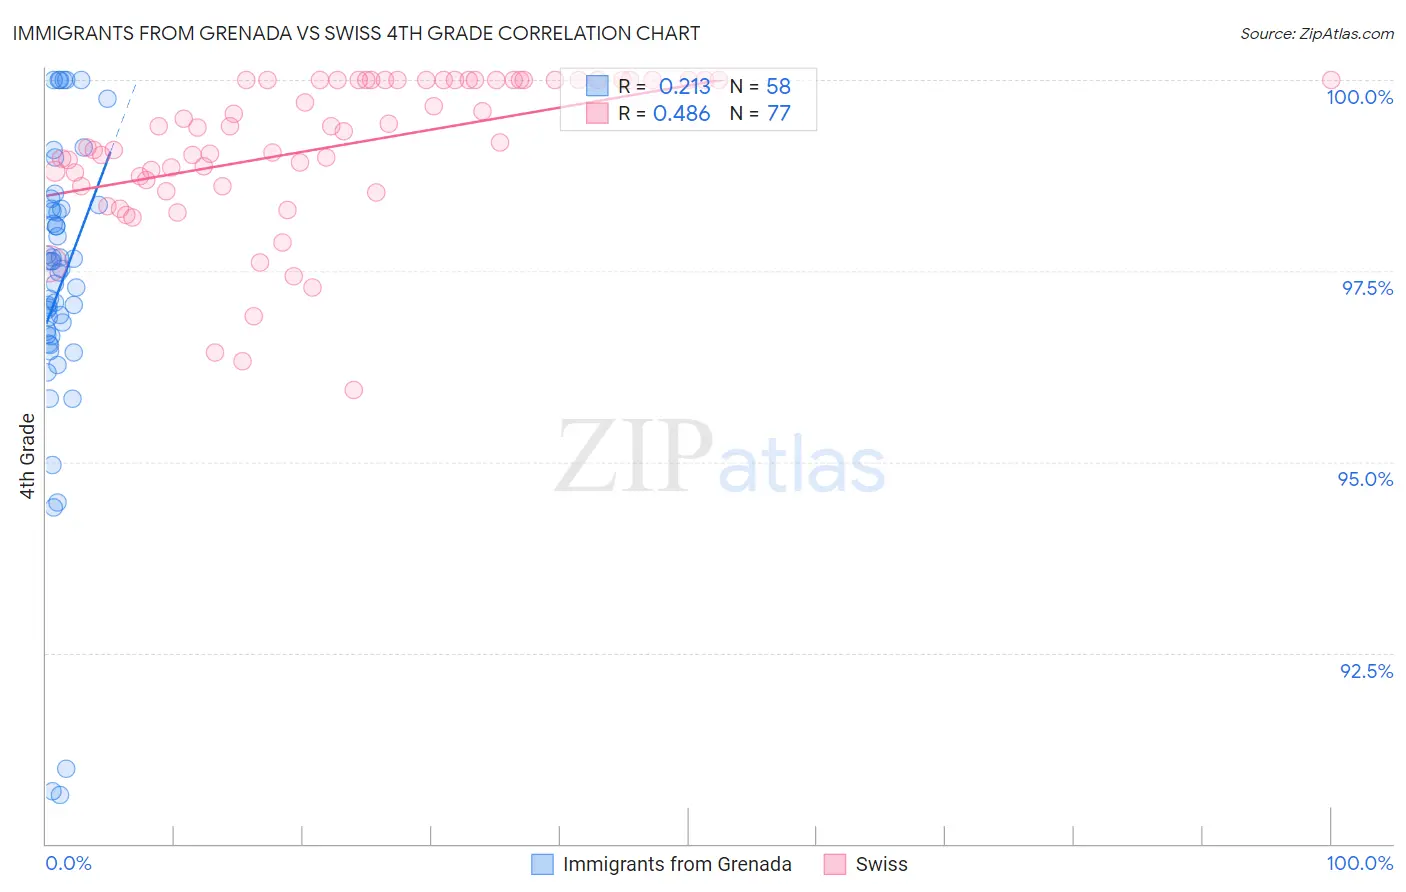
Immigrants from Grenada vs Swiss 4th Grade Correlation Chart
The statistical analysis conducted on geographies consisting of 67,199,790 people shows a weak positive correlation between the proportion of Immigrants from Grenada and percentage of population with at least 4th grade education in the United States with a correlation coefficient (R) of 0.213 and weighted average of 96.7%. Similarly, the statistical analysis conducted on geographies consisting of 465,023,158 people shows a moderate positive correlation between the proportion of Swiss and percentage of population with at least 4th grade education in the United States with a correlation coefficient (R) of 0.486 and weighted average of 98.2%, a difference of 1.6%.
4th Grade Correlation Summary
| Measurement | Immigrants from Grenada | Swiss |
| Minimum | 90.6% | 95.9% |
| Maximum | 100.0% | 100.0% |
| Range | 9.4% | 4.1% |
| Mean | 97.2% | 99.1% |
| Median | 97.5% | 99.3% |
| Interquartile 25% (IQ1) | 96.6% | 98.6% |
| Interquartile 75% (IQ3) | 98.3% | 100.0% |
| Interquartile Range (IQR) | 1.7% | 1.4% |
| Standard Deviation (Sample) | 2.0% | 0.97% |
| Standard Deviation (Population) | 2.0% | 0.97% |
Similar Demographics by 4th Grade
Demographics Similar to Immigrants from Grenada by 4th Grade
In terms of 4th grade, the demographic groups most similar to Immigrants from Grenada are Malaysian (96.7%, a difference of 0.010%), British West Indian (96.7%, a difference of 0.030%), Puerto Rican (96.7%, a difference of 0.030%), Immigrants from West Indies (96.7%, a difference of 0.040%), and Immigrants from Eritrea (96.7%, a difference of 0.050%).
| Demographics | Rating | Rank | 4th Grade |
| Immigrants | St. Vincent and the Grenadines | 0.1 /100 | #284 | Tragic 96.8% |
| Immigrants | Barbados | 0.0 /100 | #285 | Tragic 96.8% |
| Immigrants | Thailand | 0.0 /100 | #286 | Tragic 96.8% |
| Houma | 0.0 /100 | #287 | Tragic 96.8% |
| Immigrants | Afghanistan | 0.0 /100 | #288 | Tragic 96.8% |
| Immigrants | West Indies | 0.0 /100 | #289 | Tragic 96.7% |
| British West Indians | 0.0 /100 | #290 | Tragic 96.7% |
| Immigrants | Grenada | 0.0 /100 | #291 | Tragic 96.7% |
| Malaysians | 0.0 /100 | #292 | Tragic 96.7% |
| Puerto Ricans | 0.0 /100 | #293 | Tragic 96.7% |
| Immigrants | Eritrea | 0.0 /100 | #294 | Tragic 96.7% |
| Immigrants | Portugal | 0.0 /100 | #295 | Tragic 96.6% |
| Somalis | 0.0 /100 | #296 | Tragic 96.6% |
| Immigrants | Somalia | 0.0 /100 | #297 | Tragic 96.5% |
| Haitians | 0.0 /100 | #298 | Tragic 96.5% |
Demographics Similar to Swiss by 4th Grade
In terms of 4th grade, the demographic groups most similar to Swiss are Chinese (98.3%, a difference of 0.010%), Chippewa (98.2%, a difference of 0.010%), Italian (98.2%, a difference of 0.010%), British (98.2%, a difference of 0.020%), and European (98.3%, a difference of 0.040%).
| Demographics | Rating | Rank | 4th Grade |
| Croatians | 100.0 /100 | #26 | Exceptional 98.3% |
| French Canadians | 100.0 /100 | #27 | Exceptional 98.3% |
| French | 100.0 /100 | #28 | Exceptional 98.3% |
| Czechs | 100.0 /100 | #29 | Exceptional 98.3% |
| Scandinavians | 100.0 /100 | #30 | Exceptional 98.3% |
| Europeans | 100.0 /100 | #31 | Exceptional 98.3% |
| Chinese | 100.0 /100 | #32 | Exceptional 98.3% |
| Swiss | 100.0 /100 | #33 | Exceptional 98.2% |
| Chippewa | 100.0 /100 | #34 | Exceptional 98.2% |
| Italians | 100.0 /100 | #35 | Exceptional 98.2% |
| British | 100.0 /100 | #36 | Exceptional 98.2% |
| Latvians | 99.9 /100 | #37 | Exceptional 98.2% |
| Aleuts | 99.9 /100 | #38 | Exceptional 98.2% |
| Belgians | 99.9 /100 | #39 | Exceptional 98.2% |
| Luxembourgers | 99.9 /100 | #40 | Exceptional 98.2% |