Immigrants from West Indies vs Peruvian Seniors Poverty Over the Age of 65
COMPARE
Immigrants from West Indies
Peruvian
Seniors Poverty Over the Age of 65
Seniors Poverty Over the Age of 65 Comparison
Immigrants from West Indies
Peruvians
14.2%
SENIORS POVERTY OVER THE AGE OF 65
0.0/ 100
METRIC RATING
307th/ 347
METRIC RANK
11.7%
SENIORS POVERTY OVER THE AGE OF 65
4.2/ 100
METRIC RATING
220th/ 347
METRIC RANK
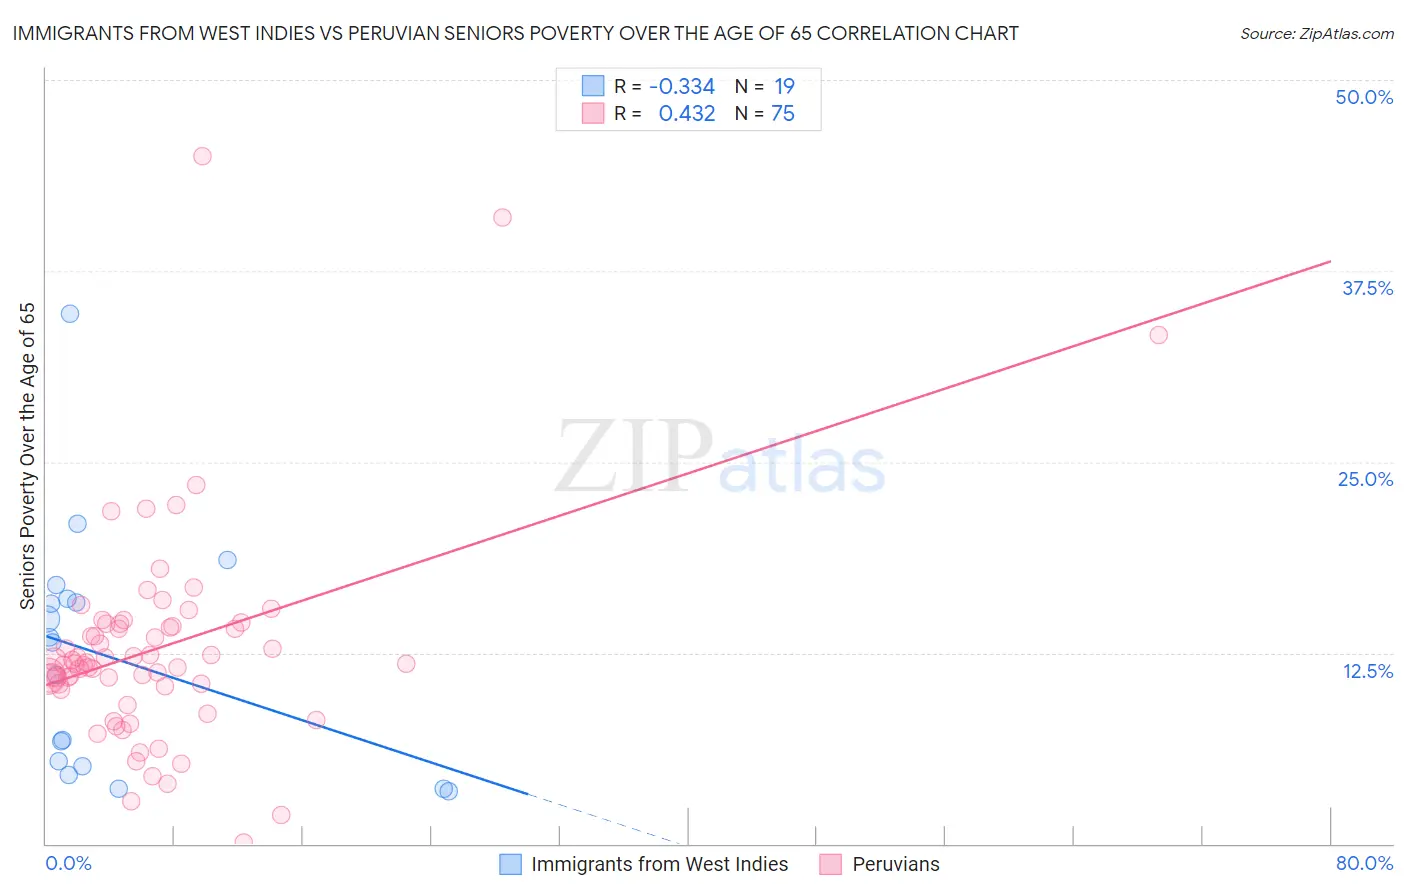
Immigrants from West Indies vs Peruvian Seniors Poverty Over the Age of 65 Correlation Chart
The statistical analysis conducted on geographies consisting of 72,451,544 people shows a mild negative correlation between the proportion of Immigrants from West Indies and poverty level among seniors over the age of 65 in the United States with a correlation coefficient (R) of -0.334 and weighted average of 14.2%. Similarly, the statistical analysis conducted on geographies consisting of 361,980,796 people shows a moderate positive correlation between the proportion of Peruvians and poverty level among seniors over the age of 65 in the United States with a correlation coefficient (R) of 0.432 and weighted average of 11.7%, a difference of 21.2%.
Seniors Poverty Over the Age of 65 Correlation Summary
| Measurement | Immigrants from West Indies | Peruvian |
| Minimum | 3.4% | 0.12% |
| Maximum | 34.7% | 45.0% |
| Range | 31.2% | 44.9% |
| Mean | 12.1% | 12.8% |
| Median | 13.2% | 11.8% |
| Interquartile 25% (IQ1) | 5.1% | 10.3% |
| Interquartile 75% (IQ3) | 16.1% | 14.4% |
| Interquartile Range (IQR) | 11.0% | 4.1% |
| Standard Deviation (Sample) | 7.9% | 7.1% |
| Standard Deviation (Population) | 7.7% | 7.0% |
Similar Demographics by Seniors Poverty Over the Age of 65
Demographics Similar to Immigrants from West Indies by Seniors Poverty Over the Age of 65
In terms of seniors poverty over the age of 65, the demographic groups most similar to Immigrants from West Indies are Trinidadian and Tobagonian (14.2%, a difference of 0.070%), Immigrants from Latin America (14.2%, a difference of 0.14%), Honduran (14.2%, a difference of 0.17%), Bahamian (14.2%, a difference of 0.43%), and Immigrants from Trinidad and Tobago (14.1%, a difference of 0.44%).
| Demographics | Rating | Rank | Seniors Poverty Over the Age of 65 |
| Immigrants | Uzbekistan | 0.0 /100 | #300 | Tragic 14.0% |
| U.S. Virgin Islanders | 0.0 /100 | #301 | Tragic 14.0% |
| Yup'ik | 0.0 /100 | #302 | Tragic 14.1% |
| Immigrants | Bangladesh | 0.0 /100 | #303 | Tragic 14.1% |
| West Indians | 0.0 /100 | #304 | Tragic 14.1% |
| Immigrants | Trinidad and Tobago | 0.0 /100 | #305 | Tragic 14.1% |
| Immigrants | Latin America | 0.0 /100 | #306 | Tragic 14.2% |
| Immigrants | West Indies | 0.0 /100 | #307 | Tragic 14.2% |
| Trinidadians and Tobagonians | 0.0 /100 | #308 | Tragic 14.2% |
| Hondurans | 0.0 /100 | #309 | Tragic 14.2% |
| Bahamians | 0.0 /100 | #310 | Tragic 14.2% |
| Natives/Alaskans | 0.0 /100 | #311 | Tragic 14.2% |
| Hispanics or Latinos | 0.0 /100 | #312 | Tragic 14.3% |
| Barbadians | 0.0 /100 | #313 | Tragic 14.4% |
| Guyanese | 0.0 /100 | #314 | Tragic 14.4% |
Demographics Similar to Peruvians by Seniors Poverty Over the Age of 65
In terms of seniors poverty over the age of 65, the demographic groups most similar to Peruvians are Argentinean (11.7%, a difference of 0.070%), Immigrants from Chile (11.7%, a difference of 0.18%), Immigrants from Congo (11.7%, a difference of 0.22%), Immigrants from Nigeria (11.7%, a difference of 0.46%), and Arapaho (11.6%, a difference of 0.48%).
| Demographics | Rating | Rank | Seniors Poverty Over the Age of 65 |
| Nepalese | 8.9 /100 | #213 | Tragic 11.5% |
| Immigrants | Russia | 8.8 /100 | #214 | Tragic 11.5% |
| French American Indians | 8.7 /100 | #215 | Tragic 11.5% |
| Immigrants | Morocco | 6.8 /100 | #216 | Tragic 11.6% |
| Immigrants | Africa | 6.4 /100 | #217 | Tragic 11.6% |
| Immigrants | Ukraine | 5.7 /100 | #218 | Tragic 11.6% |
| Arapaho | 5.2 /100 | #219 | Tragic 11.6% |
| Peruvians | 4.2 /100 | #220 | Tragic 11.7% |
| Argentineans | 4.1 /100 | #221 | Tragic 11.7% |
| Immigrants | Chile | 3.9 /100 | #222 | Tragic 11.7% |
| Immigrants | Congo | 3.8 /100 | #223 | Tragic 11.7% |
| Immigrants | Nigeria | 3.4 /100 | #224 | Tragic 11.7% |
| Immigrants | Belarus | 3.2 /100 | #225 | Tragic 11.8% |
| Liberians | 3.2 /100 | #226 | Tragic 11.8% |
| Nigerians | 3.2 /100 | #227 | Tragic 11.8% |