Immigrants from West Indies vs Ecuadorian 2nd Grade
COMPARE
Immigrants from West Indies
Ecuadorian
2nd Grade
2nd Grade Comparison
Immigrants from West Indies
Ecuadorians
97.2%
2ND GRADE
0.0/ 100
METRIC RATING
284th/ 347
METRIC RANK
96.9%
2ND GRADE
0.0/ 100
METRIC RATING
303rd/ 347
METRIC RANK
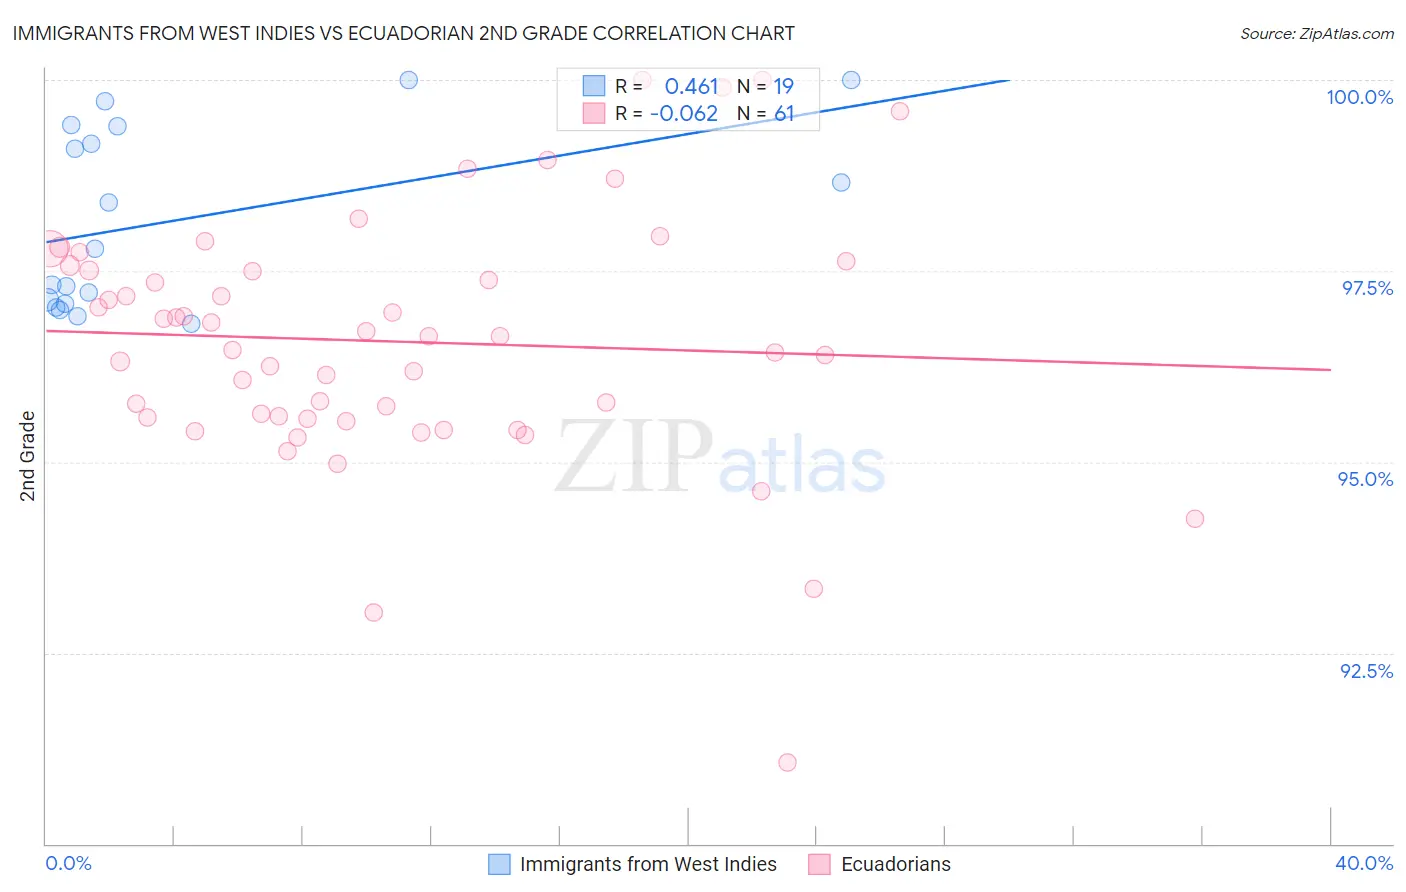
Immigrants from West Indies vs Ecuadorian 2nd Grade Correlation Chart
The statistical analysis conducted on geographies consisting of 72,457,514 people shows a moderate positive correlation between the proportion of Immigrants from West Indies and percentage of population with at least 2nd grade education in the United States with a correlation coefficient (R) of 0.461 and weighted average of 97.2%. Similarly, the statistical analysis conducted on geographies consisting of 317,865,723 people shows a slight negative correlation between the proportion of Ecuadorians and percentage of population with at least 2nd grade education in the United States with a correlation coefficient (R) of -0.062 and weighted average of 96.9%, a difference of 0.33%.
2nd Grade Correlation Summary
| Measurement | Immigrants from West Indies | Ecuadorian |
| Minimum | 96.8% | 91.1% |
| Maximum | 100.0% | 100.0% |
| Range | 3.2% | 8.9% |
| Mean | 98.2% | 96.6% |
| Median | 97.8% | 96.6% |
| Interquartile 25% (IQ1) | 97.1% | 95.6% |
| Interquartile 75% (IQ3) | 99.4% | 97.5% |
| Interquartile Range (IQR) | 2.3% | 2.0% |
| Standard Deviation (Sample) | 1.2% | 1.6% |
| Standard Deviation (Population) | 1.2% | 1.6% |
Demographics Similar to Immigrants from West Indies and Ecuadorians by 2nd Grade
In terms of 2nd grade, the demographic groups most similar to Immigrants from West Indies are Immigrants from Trinidad and Tobago (97.2%, a difference of 0.010%), Immigrants from Hong Kong (97.2%, a difference of 0.010%), Immigrants from Barbados (97.2%, a difference of 0.020%), Immigrants from Portugal (97.2%, a difference of 0.020%), and Immigrants from Thailand (97.2%, a difference of 0.020%). Similarly, the demographic groups most similar to Ecuadorians are Somali (97.0%, a difference of 0.040%), Central American Indian (97.0%, a difference of 0.060%), Immigrants from South Eastern Asia (97.0%, a difference of 0.080%), Immigrants from Cuba (97.0%, a difference of 0.10%), and Immigrants from Dominica (97.0%, a difference of 0.10%).
| Demographics | Rating | Rank | 2nd Grade |
| Immigrants | Trinidad and Tobago | 0.0 /100 | #283 | Tragic 97.2% |
| Immigrants | West Indies | 0.0 /100 | #284 | Tragic 97.2% |
| Immigrants | Hong Kong | 0.0 /100 | #285 | Tragic 97.2% |
| Immigrants | Barbados | 0.0 /100 | #286 | Tragic 97.2% |
| Immigrants | Portugal | 0.0 /100 | #287 | Tragic 97.2% |
| Immigrants | Thailand | 0.0 /100 | #288 | Tragic 97.2% |
| Houma | 0.0 /100 | #289 | Tragic 97.2% |
| Immigrants | St. Vincent and the Grenadines | 0.0 /100 | #290 | Tragic 97.2% |
| Immigrants | Afghanistan | 0.0 /100 | #291 | Tragic 97.2% |
| Immigrants | Eritrea | 0.0 /100 | #292 | Tragic 97.2% |
| British West Indians | 0.0 /100 | #293 | Tragic 97.2% |
| Malaysians | 0.0 /100 | #294 | Tragic 97.1% |
| Immigrants | Grenada | 0.0 /100 | #295 | Tragic 97.1% |
| Immigrants | Immigrants | 0.0 /100 | #296 | Tragic 97.1% |
| Immigrants | Cuba | 0.0 /100 | #297 | Tragic 97.0% |
| Immigrants | Dominica | 0.0 /100 | #298 | Tragic 97.0% |
| Haitians | 0.0 /100 | #299 | Tragic 97.0% |
| Immigrants | South Eastern Asia | 0.0 /100 | #300 | Tragic 97.0% |
| Central American Indians | 0.0 /100 | #301 | Tragic 97.0% |
| Somalis | 0.0 /100 | #302 | Tragic 97.0% |
| Ecuadorians | 0.0 /100 | #303 | Tragic 96.9% |