Fijian vs Ecuadorian 2nd Grade
COMPARE
Fijian
Ecuadorian
2nd Grade
2nd Grade Comparison
Fijians
Ecuadorians
97.5%
2ND GRADE
0.5/ 100
METRIC RATING
259th/ 347
METRIC RANK
96.9%
2ND GRADE
0.0/ 100
METRIC RATING
303rd/ 347
METRIC RANK
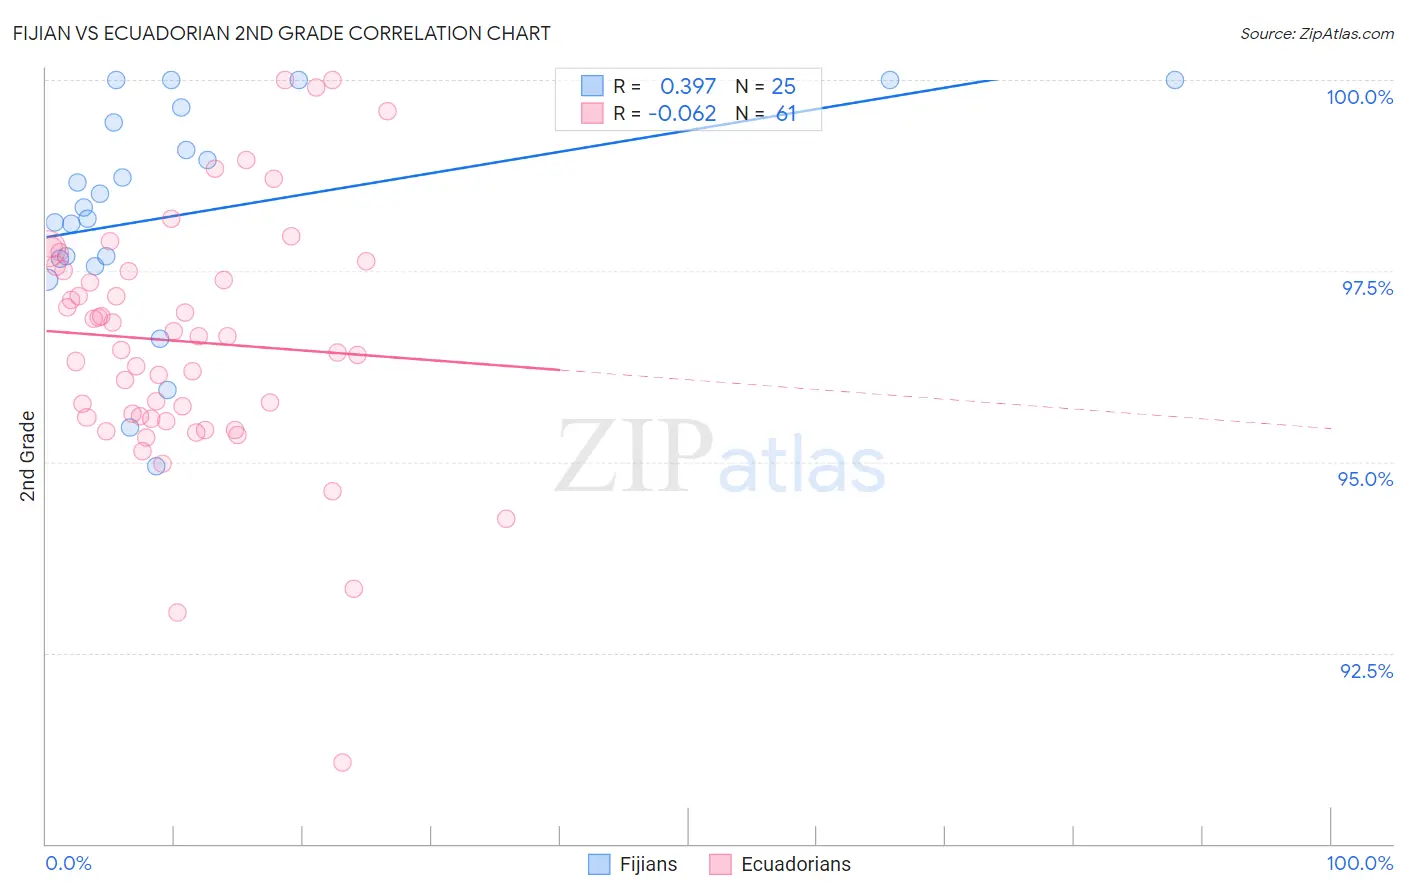
Fijian vs Ecuadorian 2nd Grade Correlation Chart
The statistical analysis conducted on geographies consisting of 55,948,842 people shows a mild positive correlation between the proportion of Fijians and percentage of population with at least 2nd grade education in the United States with a correlation coefficient (R) of 0.397 and weighted average of 97.5%. Similarly, the statistical analysis conducted on geographies consisting of 317,865,723 people shows a slight negative correlation between the proportion of Ecuadorians and percentage of population with at least 2nd grade education in the United States with a correlation coefficient (R) of -0.062 and weighted average of 96.9%, a difference of 0.56%.
2nd Grade Correlation Summary
| Measurement | Fijian | Ecuadorian |
| Minimum | 94.9% | 91.1% |
| Maximum | 100.0% | 100.0% |
| Range | 5.1% | 8.9% |
| Mean | 98.3% | 96.6% |
| Median | 98.3% | 96.6% |
| Interquartile 25% (IQ1) | 97.6% | 95.6% |
| Interquartile 75% (IQ3) | 99.5% | 97.5% |
| Interquartile Range (IQR) | 1.9% | 2.0% |
| Standard Deviation (Sample) | 1.4% | 1.6% |
| Standard Deviation (Population) | 1.4% | 1.6% |
Similar Demographics by 2nd Grade
Demographics Similar to Fijians by 2nd Grade
In terms of 2nd grade, the demographic groups most similar to Fijians are Yaqui (97.5%, a difference of 0.0%), Assyrian/Chaldean/Syriac (97.5%, a difference of 0.0%), Immigrants from Congo (97.5%, a difference of 0.010%), Jamaican (97.5%, a difference of 0.010%), and Immigrants from Colombia (97.5%, a difference of 0.010%).
| Demographics | Rating | Rank | 2nd Grade |
| Immigrants | Asia | 0.7 /100 | #252 | Tragic 97.5% |
| Puerto Ricans | 0.7 /100 | #253 | Tragic 97.5% |
| Indians (Asian) | 0.6 /100 | #254 | Tragic 97.5% |
| Immigrants | Congo | 0.6 /100 | #255 | Tragic 97.5% |
| Jamaicans | 0.6 /100 | #256 | Tragic 97.5% |
| Immigrants | Colombia | 0.5 /100 | #257 | Tragic 97.5% |
| Yaqui | 0.5 /100 | #258 | Tragic 97.5% |
| Fijians | 0.5 /100 | #259 | Tragic 97.5% |
| Assyrians/Chaldeans/Syriacs | 0.5 /100 | #260 | Tragic 97.5% |
| Armenians | 0.5 /100 | #261 | Tragic 97.5% |
| Taiwanese | 0.4 /100 | #262 | Tragic 97.4% |
| Immigrants | Ethiopia | 0.4 /100 | #263 | Tragic 97.4% |
| Immigrants | Liberia | 0.4 /100 | #264 | Tragic 97.4% |
| Immigrants | South America | 0.4 /100 | #265 | Tragic 97.4% |
| Immigrants | Sierra Leone | 0.4 /100 | #266 | Tragic 97.4% |
Demographics Similar to Ecuadorians by 2nd Grade
In terms of 2nd grade, the demographic groups most similar to Ecuadorians are Immigrants from Caribbean (96.9%, a difference of 0.0%), Nicaraguan (96.9%, a difference of 0.020%), Somali (97.0%, a difference of 0.040%), Immigrants from Somalia (96.9%, a difference of 0.040%), and Central American Indian (97.0%, a difference of 0.060%).
| Demographics | Rating | Rank | 2nd Grade |
| Immigrants | Immigrants | 0.0 /100 | #296 | Tragic 97.1% |
| Immigrants | Cuba | 0.0 /100 | #297 | Tragic 97.0% |
| Immigrants | Dominica | 0.0 /100 | #298 | Tragic 97.0% |
| Haitians | 0.0 /100 | #299 | Tragic 97.0% |
| Immigrants | South Eastern Asia | 0.0 /100 | #300 | Tragic 97.0% |
| Central American Indians | 0.0 /100 | #301 | Tragic 97.0% |
| Somalis | 0.0 /100 | #302 | Tragic 97.0% |
| Ecuadorians | 0.0 /100 | #303 | Tragic 96.9% |
| Immigrants | Caribbean | 0.0 /100 | #304 | Tragic 96.9% |
| Nicaraguans | 0.0 /100 | #305 | Tragic 96.9% |
| Immigrants | Somalia | 0.0 /100 | #306 | Tragic 96.9% |
| Immigrants | Azores | 0.0 /100 | #307 | Tragic 96.8% |
| Immigrants | Haiti | 0.0 /100 | #308 | Tragic 96.8% |
| Belizeans | 0.0 /100 | #309 | Tragic 96.8% |
| Sri Lankans | 0.0 /100 | #310 | Tragic 96.8% |