Immigrants from West Indies vs Chinese 4th Grade
COMPARE
Immigrants from West Indies
Chinese
4th Grade
4th Grade Comparison
Immigrants from West Indies
Chinese
96.7%
4TH GRADE
0.0/ 100
METRIC RATING
289th/ 347
METRIC RANK
98.3%
4TH GRADE
100.0/ 100
METRIC RATING
32nd/ 347
METRIC RANK
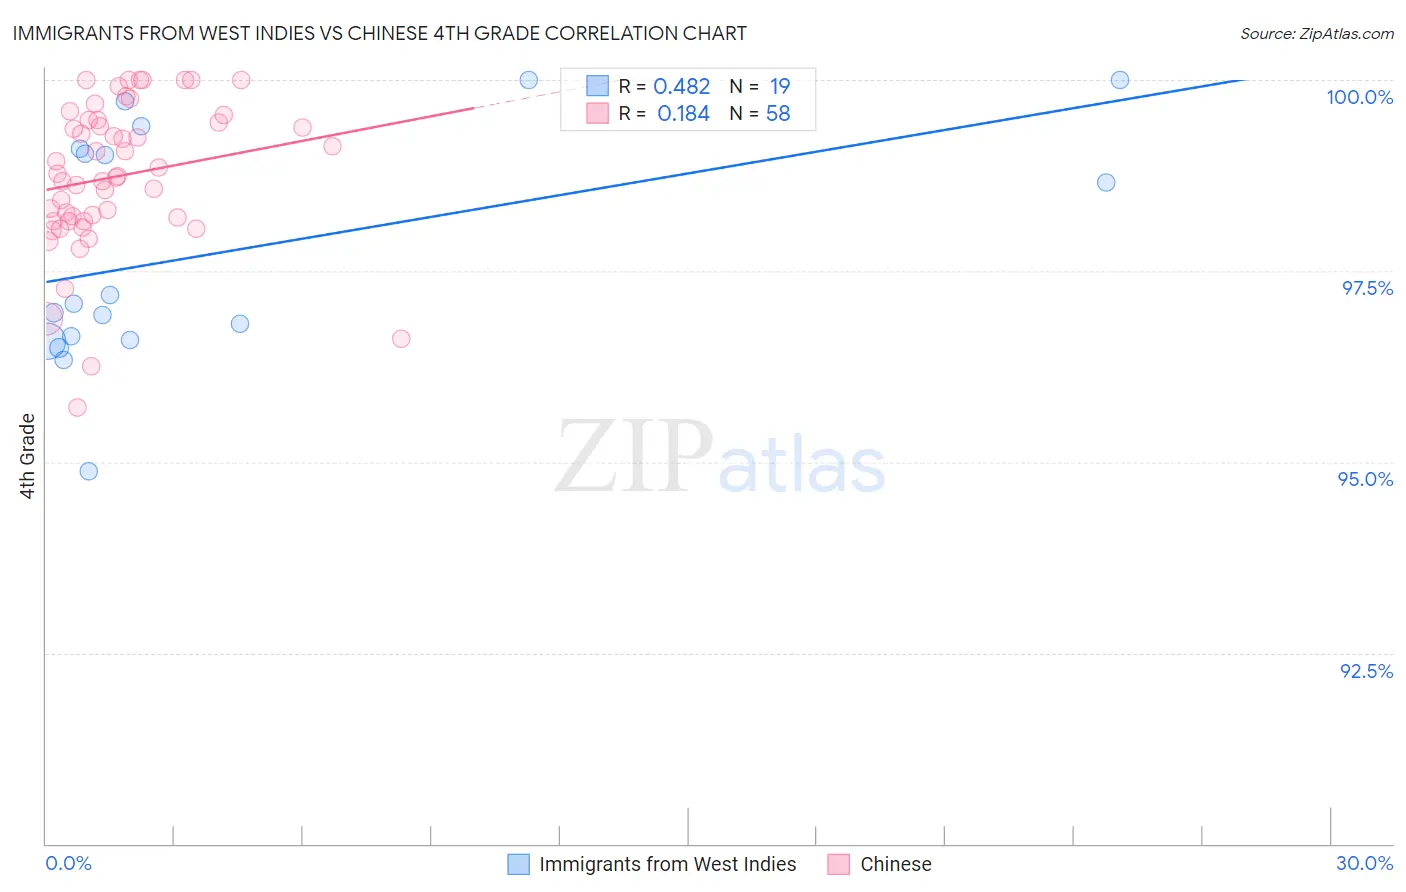
Immigrants from West Indies vs Chinese 4th Grade Correlation Chart
The statistical analysis conducted on geographies consisting of 72,457,514 people shows a moderate positive correlation between the proportion of Immigrants from West Indies and percentage of population with at least 4th grade education in the United States with a correlation coefficient (R) of 0.482 and weighted average of 96.7%. Similarly, the statistical analysis conducted on geographies consisting of 64,808,307 people shows a poor positive correlation between the proportion of Chinese and percentage of population with at least 4th grade education in the United States with a correlation coefficient (R) of 0.184 and weighted average of 98.3%, a difference of 1.6%.
4th Grade Correlation Summary
| Measurement | Immigrants from West Indies | Chinese |
| Minimum | 94.9% | 95.7% |
| Maximum | 100.0% | 100.0% |
| Range | 5.1% | 4.3% |
| Mean | 97.8% | 98.7% |
| Median | 97.1% | 98.8% |
| Interquartile 25% (IQ1) | 96.6% | 98.2% |
| Interquartile 75% (IQ3) | 99.1% | 99.5% |
| Interquartile Range (IQR) | 2.5% | 1.3% |
| Standard Deviation (Sample) | 1.5% | 0.97% |
| Standard Deviation (Population) | 1.5% | 0.96% |
Similar Demographics by 4th Grade
Demographics Similar to Immigrants from West Indies by 4th Grade
In terms of 4th grade, the demographic groups most similar to Immigrants from West Indies are British West Indian (96.7%, a difference of 0.010%), Houma (96.8%, a difference of 0.020%), Immigrants from Afghanistan (96.8%, a difference of 0.020%), Immigrants from Grenada (96.7%, a difference of 0.040%), and Malaysian (96.7%, a difference of 0.050%).
| Demographics | Rating | Rank | 4th Grade |
| Immigrants | Trinidad and Tobago | 0.1 /100 | #282 | Tragic 96.8% |
| Immigrants | Philippines | 0.1 /100 | #283 | Tragic 96.8% |
| Immigrants | St. Vincent and the Grenadines | 0.1 /100 | #284 | Tragic 96.8% |
| Immigrants | Barbados | 0.0 /100 | #285 | Tragic 96.8% |
| Immigrants | Thailand | 0.0 /100 | #286 | Tragic 96.8% |
| Houma | 0.0 /100 | #287 | Tragic 96.8% |
| Immigrants | Afghanistan | 0.0 /100 | #288 | Tragic 96.8% |
| Immigrants | West Indies | 0.0 /100 | #289 | Tragic 96.7% |
| British West Indians | 0.0 /100 | #290 | Tragic 96.7% |
| Immigrants | Grenada | 0.0 /100 | #291 | Tragic 96.7% |
| Malaysians | 0.0 /100 | #292 | Tragic 96.7% |
| Puerto Ricans | 0.0 /100 | #293 | Tragic 96.7% |
| Immigrants | Eritrea | 0.0 /100 | #294 | Tragic 96.7% |
| Immigrants | Portugal | 0.0 /100 | #295 | Tragic 96.6% |
| Somalis | 0.0 /100 | #296 | Tragic 96.6% |
Demographics Similar to Chinese by 4th Grade
In terms of 4th grade, the demographic groups most similar to Chinese are Swiss (98.2%, a difference of 0.010%), Chippewa (98.2%, a difference of 0.020%), Italian (98.2%, a difference of 0.020%), Scandinavian (98.3%, a difference of 0.030%), and European (98.3%, a difference of 0.030%).
| Demographics | Rating | Rank | 4th Grade |
| Scotch-Irish | 100.0 /100 | #25 | Exceptional 98.3% |
| Croatians | 100.0 /100 | #26 | Exceptional 98.3% |
| French Canadians | 100.0 /100 | #27 | Exceptional 98.3% |
| French | 100.0 /100 | #28 | Exceptional 98.3% |
| Czechs | 100.0 /100 | #29 | Exceptional 98.3% |
| Scandinavians | 100.0 /100 | #30 | Exceptional 98.3% |
| Europeans | 100.0 /100 | #31 | Exceptional 98.3% |
| Chinese | 100.0 /100 | #32 | Exceptional 98.3% |
| Swiss | 100.0 /100 | #33 | Exceptional 98.2% |
| Chippewa | 100.0 /100 | #34 | Exceptional 98.2% |
| Italians | 100.0 /100 | #35 | Exceptional 98.2% |
| British | 100.0 /100 | #36 | Exceptional 98.2% |
| Latvians | 99.9 /100 | #37 | Exceptional 98.2% |
| Aleuts | 99.9 /100 | #38 | Exceptional 98.2% |
| Belgians | 99.9 /100 | #39 | Exceptional 98.2% |