Immigrants from Vietnam vs Immigrants from Canada Bachelor's Degree

COMPARE

Immigrants from Vietnam
Race
Ancestry
AfghanAfricanAlaska NativeAlaskan AthabascanAlbanianAleutAlsatianAmericanApacheArabArapahoArgentineanArmenianAssyrian/Chaldean/SyriacAustralianAustrianBahamianBangladeshiBarbadianBasqueBelgianBelizeanBermudanBhutaneseBlackfeetBolivianBrazilianBritishBritish West IndianBulgarianBurmeseCajunCambodianCanadianCape VerdeanCarpatho RusynCelticCentral AmericanCentral American IndianCherokeeCheyenneChickasawChileanChineseChippewaChoctawColombianColvilleComancheCosta RicanCreeCreekCroatianCrowCubanCypriotCzechCzechoslovakianDanishDelawareDominicanDutchDutch West IndianEastern EuropeanEcuadorianEgyptianEnglishEstonianEthiopianEuropeanFijianFilipinoFinnishFrenchFrench American IndianFrench CanadianGermanGerman RussianGhanaianGreekGuamanian/ChamorroGuatemalanGuyaneseHaitianHmongHonduranHopiHoumaHungarianIcelanderIndian (Asian)IndonesianInupiatIranianIraqiIrishIroquoisIsraeliItalianJamaicanJapaneseJordanianKenyanKiowaKoreanLaotianLatvianLebaneseLiberianLithuanianLumbeeLuxembourgerMacedonianMalaysianMalteseMarshalleseMenomineeMexicanMexican American IndianMongolianMoroccanNative HawaiianNavajoNepaleseNew ZealanderNicaraguanNigerianNorthern EuropeanNorwegianOkinawanOsageOttawaPaiutePakistaniPalestinianPanamanianParaguayanPennsylvania GermanPeruvianPimaPolishPortuguesePotawatomiPuebloPuerto RicanPuget Sound SalishRomanianRussianSalvadoranSamoanScandinavianScotch-IrishScottishSeminoleSenegaleseSerbianShoshoneSierra LeoneanSiouxSlavicSlovakSloveneSomaliSouth AfricanSouth AmericanSouth American IndianSoviet UnionSpaniardSpanishSpanish AmericanSpanish American IndianSri LankanSubsaharan AfricanSudaneseSwedishSwissSyrianTaiwaneseThaiTlingit-HaidaTohono O'OdhamTonganTrinidadian and TobagonianTsimshianTurkishU.S. Virgin IslanderUgandanUkrainianUruguayanUteVenezuelanVietnameseWelshWest IndianYakamaYaquiYugoslavianYumanYup'ikZimbabwean
Immigration
NonimmigrantsImmigrantsAfghanistanAfricaAlbaniaArgentinaArmeniaAsiaAustraliaAustriaBahamasBangladeshBarbadosBelarusBelgiumBelizeBoliviaBosnia and HerzegovinaBrazilBulgariaBurma/MyanmarCabo VerdeCambodiaCameroonCaribbeanCentral AmericaChileChinaColombiaCongoCosta RicaCroatiaCubaCzechoslovakiaDenmarkDominicaDominican RepublicEastern AfricaEastern AsiaEastern EuropeEcuadorEgyptEl SalvadorEnglandEritreaEthiopiaEuropeFijiFranceGermanyGhanaGreeceGrenadaGuatemalaGuyanaHaitiHondurasHong KongHungaryIndiaIndonesiaIranIraqIrelandIsraelItalyJamaicaJapanJordanKazakhstanKenyaKoreaKuwaitLaosLatin AmericaLatviaLebanonLiberiaLithuaniaMalaysiaMexicoMicronesiaMiddle AfricaMoldovaMoroccoNepalNetherlandsNicaraguaNigeriaNorth AmericaNorth MacedoniaNorthern AfricaNorthern EuropeNorwayOceaniaPakistanPanamaPeruPhilippinesPolandPortugalRomaniaRussiaSaudi ArabiaScotlandSenegalSerbiaSierra LeoneSingaporeSomaliaSouth AfricaSouth AmericaSouth Central AsiaSouth Eastern AsiaSouthern EuropeSpainSri LankaSt. Vincent and the GrenadinesSudanSwedenSwitzerlandSyriaTaiwanThailandTrinidad and TobagoTurkeyUgandaUkraineUruguayUzbekistanVenezuelaVietnamWest IndiesWestern AfricaWestern AsiaWestern EuropeYemenZaireZimbabweAzores
Immigrants from Canada
Race
Ancestry
AfghanAfricanAlaska NativeAlaskan AthabascanAlbanianAleutAlsatianAmericanApacheArabArapahoArgentineanArmenianAssyrian/Chaldean/SyriacAustralianAustrianBahamianBangladeshiBarbadianBasqueBelgianBelizeanBermudanBhutaneseBlackfeetBolivianBrazilianBritishBritish West IndianBulgarianBurmeseCajunCambodianCanadianCape VerdeanCarpatho RusynCelticCentral AmericanCentral American IndianCherokeeCheyenneChickasawChileanChineseChippewaChoctawColombianColvilleComancheCosta RicanCreeCreekCroatianCrowCubanCypriotCzechCzechoslovakianDanishDelawareDominicanDutchDutch West IndianEastern EuropeanEcuadorianEgyptianEnglishEstonianEthiopianEuropeanFijianFilipinoFinnishFrenchFrench American IndianFrench CanadianGermanGerman RussianGhanaianGreekGuamanian/ChamorroGuatemalanGuyaneseHaitianHmongHonduranHopiHoumaHungarianIcelanderIndian (Asian)IndonesianInupiatIranianIraqiIrishIroquoisIsraeliItalianJamaicanJapaneseJordanianKenyanKiowaKoreanLaotianLatvianLebaneseLiberianLithuanianLumbeeLuxembourgerMacedonianMalaysianMalteseMarshalleseMenomineeMexicanMexican American IndianMongolianMoroccanNative HawaiianNavajoNepaleseNew ZealanderNicaraguanNigerianNorthern EuropeanNorwegianOkinawanOsageOttawaPaiutePakistaniPalestinianPanamanianParaguayanPennsylvania GermanPeruvianPimaPolishPortuguesePotawatomiPuebloPuerto RicanPuget Sound SalishRomanianRussianSalvadoranSamoanScandinavianScotch-IrishScottishSeminoleSenegaleseSerbianShoshoneSierra LeoneanSiouxSlavicSlovakSloveneSomaliSouth AfricanSouth AmericanSouth American IndianSoviet UnionSpaniardSpanishSpanish AmericanSpanish American IndianSri LankanSubsaharan AfricanSudaneseSwedishSwissSyrianTaiwaneseThaiTlingit-HaidaTohono O'OdhamTonganTrinidadian and TobagonianTsimshianTurkishU.S. Virgin IslanderUgandanUkrainianUruguayanUteVenezuelanVietnameseWelshWest IndianYakamaYaquiYugoslavianYumanYup'ikZimbabwean
Immigration
NonimmigrantsImmigrantsAfghanistanAfricaAlbaniaArgentinaArmeniaAsiaAustraliaAustriaBahamasBangladeshBarbadosBelarusBelgiumBelizeBoliviaBosnia and HerzegovinaBrazilBulgariaBurma/MyanmarCabo VerdeCambodiaCameroonCanadaCaribbeanCentral AmericaChileChinaColombiaCongoCosta RicaCroatiaCubaCzechoslovakiaDenmarkDominicaDominican RepublicEastern AfricaEastern AsiaEastern EuropeEcuadorEgyptEl SalvadorEnglandEritreaEthiopiaEuropeFijiFranceGermanyGhanaGreeceGrenadaGuatemalaGuyanaHaitiHondurasHong KongHungaryIndiaIndonesiaIranIraqIrelandIsraelItalyJamaicaJapanJordanKazakhstanKenyaKoreaKuwaitLaosLatin AmericaLatviaLebanonLiberiaLithuaniaMalaysiaMexicoMicronesiaMiddle AfricaMoldovaMoroccoNepalNetherlandsNicaraguaNigeriaNorth AmericaNorth MacedoniaNorthern AfricaNorthern EuropeNorwayOceaniaPakistanPanamaPeruPhilippinesPolandPortugalRomaniaRussiaSaudi ArabiaScotlandSenegalSerbiaSierra LeoneSingaporeSomaliaSouth AfricaSouth AmericaSouth Central AsiaSouth Eastern AsiaSouthern EuropeSpainSri LankaSt. Vincent and the GrenadinesSudanSwedenSwitzerlandSyriaTaiwanThailandTrinidad and TobagoTurkeyUgandaUkraineUruguayUzbekistanVenezuelaWest IndiesWestern AfricaWestern AsiaWestern EuropeYemenZaireZimbabweAzores
Bachelor's Degree
Income
Poverty
Unemployment
Labor Participation
Family Structure
Vehicle Availability
Education Level
Disability

Bachelor's Degree Comparison

Immigrants from Vietnam

Immigrants from Canada

Fair
Exceptional
37.1%
BACHELOR'S DEGREE
32.1/ 100
METRIC RATING
192nd/ 347
METRIC RANK
41.7%
BACHELOR'S DEGREE
98.6/ 100
METRIC RATING
93rd/ 347
METRIC RANK

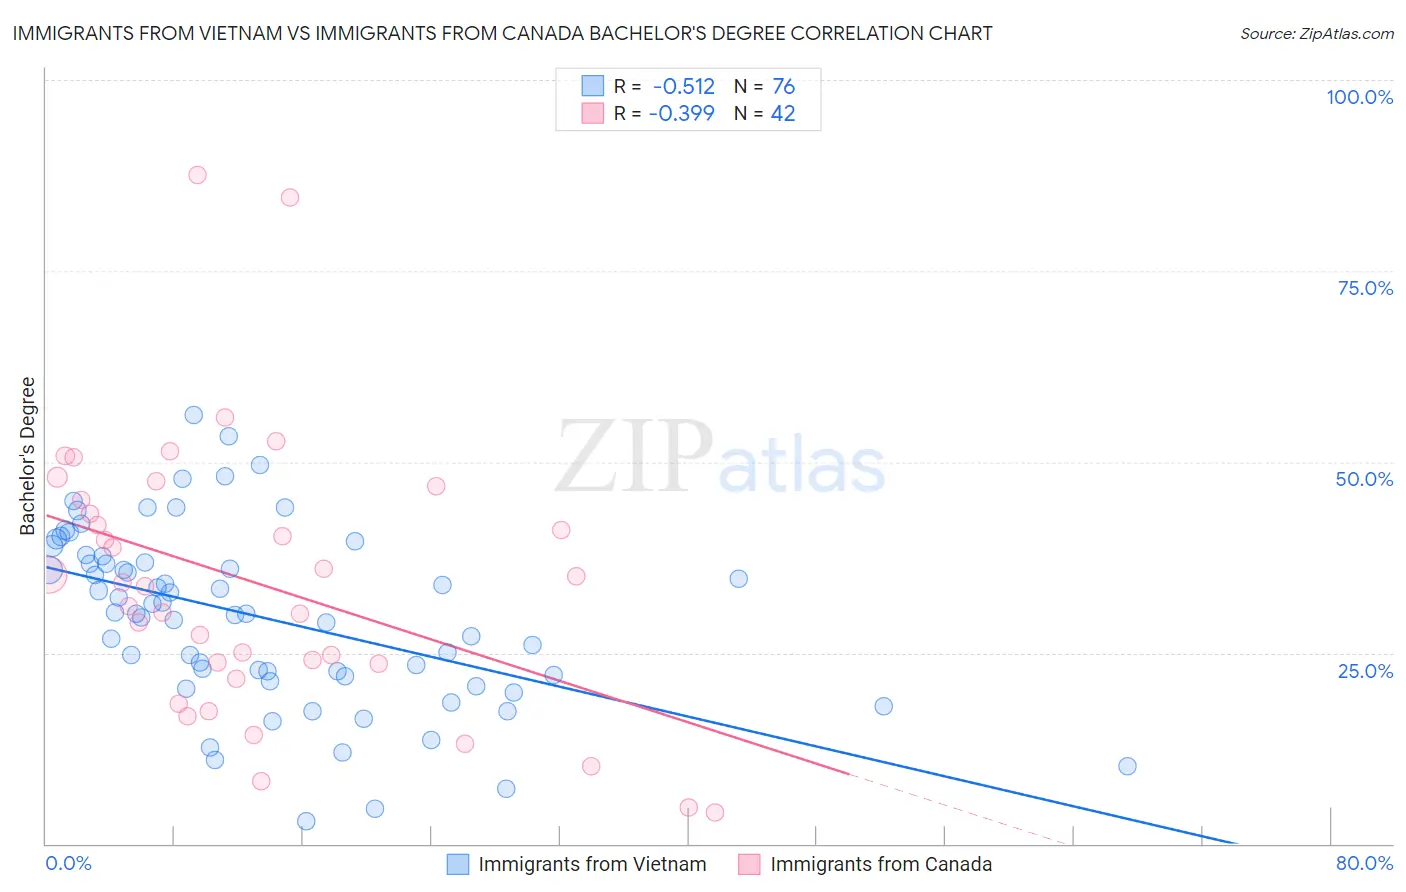
Immigrants from Vietnam vs Immigrants from Canada Bachelor's Degree Correlation Chart

The statistical analysis conducted on geographies consisting of 404,813,779 people shows a substantial negative correlation between the proportion of Immigrants from Vietnam and percentage of population with at least bachelor's degree education in the United States with a correlation coefficient (R) of -0.512 and weighted average of 37.1%. Similarly, the statistical analysis conducted on geographies consisting of 459,364,356 people shows a mild negative correlation between the proportion of Immigrants from Canada and percentage of population with at least bachelor's degree education in the United States with a correlation coefficient (R) of -0.399 and weighted average of 41.7%, a difference of 12.3%.
Immigrants from Vietnam vs Immigrants from Canada Bachelor's Degree

Bachelor's Degree Correlation Summary

MeasurementImmigrants from VietnamImmigrants from Canada
Minimum2.9%4.2%
Maximum56.2%87.6%
Range53.3%83.5%
Mean29.7%34.2%
Median30.2%33.9%
Interquartile 25% (IQ1)22.0%23.5%
Interquartile 75% (IQ3)37.2%45.0%
Interquartile Range (IQR)15.2%21.5%
Standard Deviation (Sample)11.5%18.1%
Standard Deviation (Population)11.4%17.9%

Similar Demographics by Bachelor's Degree

Demographics Similar to Immigrants from Vietnam by Bachelor's Degree

In terms of bachelor's degree, the demographic groups most similar to Immigrants from Vietnam are Yugoslavian (37.1%, a difference of 0.060%), Nigerian (37.2%, a difference of 0.20%), Swiss (37.2%, a difference of 0.22%), Belgian (37.0%, a difference of 0.25%), and Korean (37.0%, a difference of 0.27%).
DemographicsRating | RankBachelor's Degree
Immigrants | Peru
41.3
/100
|
#185
Average
37.5%
Norwegians
40.4
/100
|
#186
Average
37.5%
English
39.7
/100
|
#187
Fair
37.4%
Immigrants | Oceania
37.3
/100
|
#188
Fair
37.3%
Slovaks
36.9
/100
|
#189
Fair
37.3%
Swiss
34.1
/100
|
#190
Fair
37.2%
Nigerians
33.9
/100
|
#191
Fair
37.2%
Immigrants | Vietnam
32.1
/100
|
#192
Fair
37.1%
Yugoslavians
31.5
/100
|
#193
Fair
37.1%
Belgians
29.9
/100
|
#194
Fair
37.0%
Koreans
29.8
/100
|
#195
Fair
37.0%
Celtics
29.5
/100
|
#196
Fair
37.0%
Czechoslovakians
29.2
/100
|
#197
Fair
37.0%
Welsh
29.1
/100
|
#198
Fair
37.0%
Immigrants | Costa Rica
27.4
/100
|
#199
Fair
36.9%

Demographics Similar to Immigrants from Canada by Bachelor's Degree

In terms of bachelor's degree, the demographic groups most similar to Immigrants from Canada are Immigrants from Nepal (41.7%, a difference of 0.020%), Immigrants from North America (41.7%, a difference of 0.15%), Immigrants from Moldova (41.6%, a difference of 0.26%), Romanian (41.6%, a difference of 0.31%), and Immigrants from Ukraine (41.5%, a difference of 0.42%).
DemographicsRating | RankBachelor's Degree
Immigrants | Brazil
99.2
/100
|
#86
Exceptional
42.2%
Carpatho Rusyns
99.0
/100
|
#87
Exceptional
42.1%
Immigrants | Western Europe
99.0
/100
|
#88
Exceptional
42.0%
Greeks
99.0
/100
|
#89
Exceptional
42.0%
Laotians
98.9
/100
|
#90
Exceptional
42.0%
Immigrants | Northern Africa
98.9
/100
|
#91
Exceptional
41.9%
Maltese
98.8
/100
|
#92
Exceptional
41.9%
Immigrants | Canada
98.6
/100
|
#93
Exceptional
41.7%
Immigrants | Nepal
98.6
/100
|
#94
Exceptional
41.7%
Immigrants | North America
98.5
/100
|
#95
Exceptional
41.7%
Immigrants | Moldova
98.4
/100
|
#96
Exceptional
41.6%
Romanians
98.4
/100
|
#97
Exceptional
41.6%
Immigrants | Ukraine
98.3
/100
|
#98
Exceptional
41.5%
Immigrants | England
98.1
/100
|
#99
Exceptional
41.4%
Macedonians
98.1
/100
|
#100
Exceptional
41.4%