Immigrants from Venezuela vs Scandinavian 2nd Grade
COMPARE
Immigrants from Venezuela
Scandinavian
2nd Grade
2nd Grade Comparison
Immigrants from Venezuela
Scandinavians
97.9%
2ND GRADE
46.1/ 100
METRIC RATING
179th/ 347
METRIC RANK
98.5%
2ND GRADE
100.0/ 100
METRIC RATING
33rd/ 347
METRIC RANK
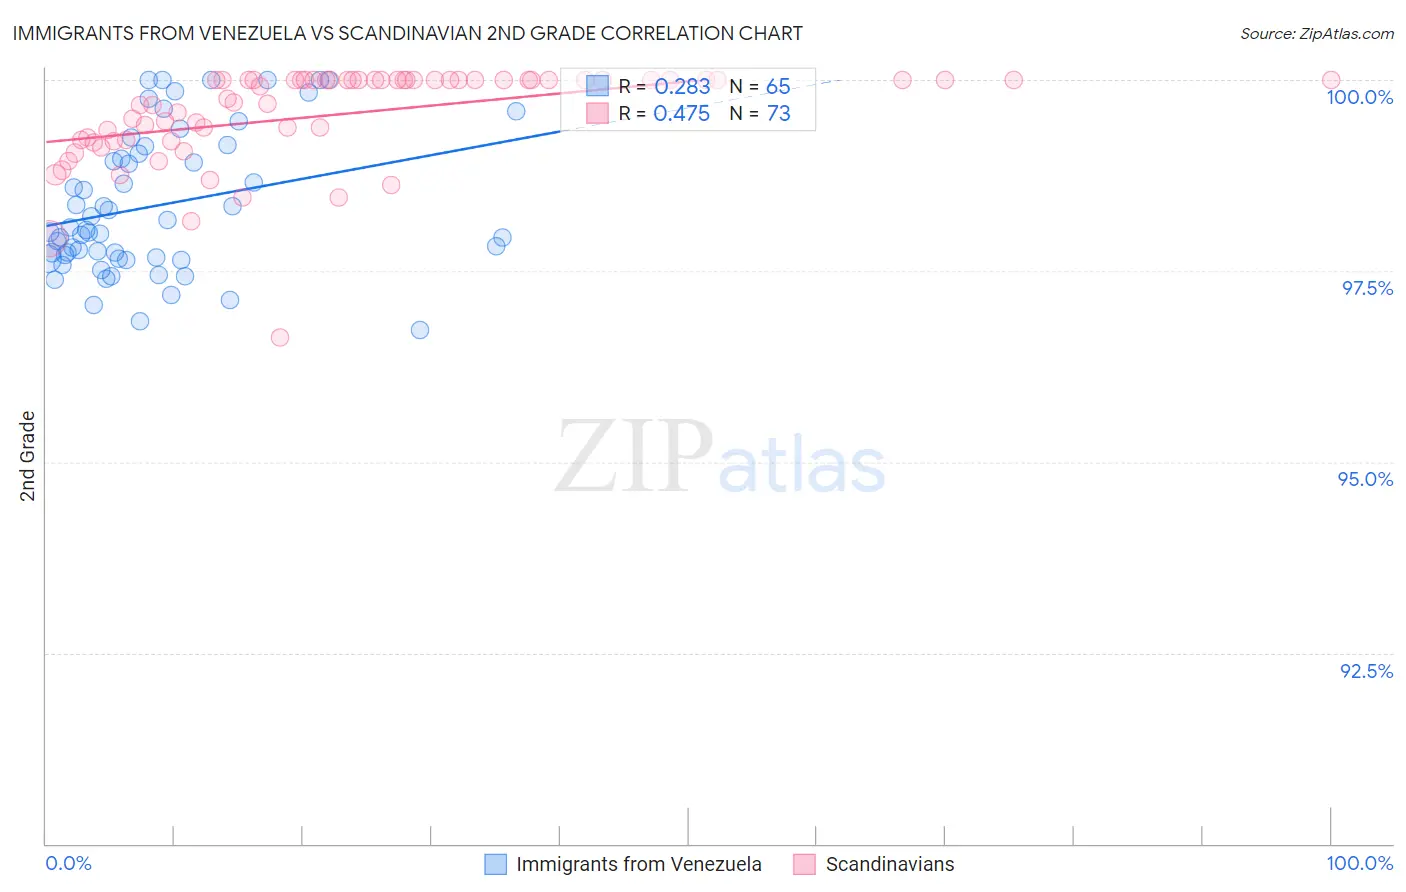
Immigrants from Venezuela vs Scandinavian 2nd Grade Correlation Chart
The statistical analysis conducted on geographies consisting of 287,866,009 people shows a weak positive correlation between the proportion of Immigrants from Venezuela and percentage of population with at least 2nd grade education in the United States with a correlation coefficient (R) of 0.283 and weighted average of 97.9%. Similarly, the statistical analysis conducted on geographies consisting of 472,660,430 people shows a moderate positive correlation between the proportion of Scandinavians and percentage of population with at least 2nd grade education in the United States with a correlation coefficient (R) of 0.475 and weighted average of 98.5%, a difference of 0.66%.
2nd Grade Correlation Summary
| Measurement | Immigrants from Venezuela | Scandinavian |
| Minimum | 96.7% | 96.6% |
| Maximum | 100.0% | 100.0% |
| Range | 3.3% | 3.4% |
| Mean | 98.4% | 99.5% |
| Median | 98.0% | 100.0% |
| Interquartile 25% (IQ1) | 97.7% | 99.2% |
| Interquartile 75% (IQ3) | 99.1% | 100.0% |
| Interquartile Range (IQR) | 1.4% | 0.79% |
| Standard Deviation (Sample) | 0.92% | 0.63% |
| Standard Deviation (Population) | 0.91% | 0.63% |
Similar Demographics by 2nd Grade
Demographics Similar to Immigrants from Venezuela by 2nd Grade
In terms of 2nd grade, the demographic groups most similar to Immigrants from Venezuela are Immigrants from Brazil (97.9%, a difference of 0.0%), Argentinean (97.9%, a difference of 0.0%), Immigrants from Micronesia (97.9%, a difference of 0.010%), Immigrants from Bosnia and Herzegovina (97.9%, a difference of 0.010%), and Immigrants from Sri Lanka (97.9%, a difference of 0.010%).
| Demographics | Rating | Rank | 2nd Grade |
| Immigrants | Korea | 52.7 /100 | #172 | Average 97.9% |
| Kenyans | 52.7 /100 | #173 | Average 97.9% |
| Immigrants | Micronesia | 50.0 /100 | #174 | Average 97.9% |
| Immigrants | Bosnia and Herzegovina | 49.8 /100 | #175 | Average 97.9% |
| Immigrants | Sri Lanka | 48.7 /100 | #176 | Average 97.9% |
| Immigrants | Brazil | 46.6 /100 | #177 | Average 97.9% |
| Argentineans | 46.3 /100 | #178 | Average 97.9% |
| Immigrants | Venezuela | 46.1 /100 | #179 | Average 97.9% |
| Natives/Alaskans | 44.3 /100 | #180 | Average 97.9% |
| Egyptians | 44.3 /100 | #181 | Average 97.9% |
| Portuguese | 42.4 /100 | #182 | Average 97.8% |
| Immigrants | Poland | 42.2 /100 | #183 | Average 97.8% |
| Immigrants | Belarus | 41.5 /100 | #184 | Average 97.8% |
| Immigrants | Argentina | 40.6 /100 | #185 | Average 97.8% |
| Arabs | 36.9 /100 | #186 | Fair 97.8% |
Demographics Similar to Scandinavians by 2nd Grade
In terms of 2nd grade, the demographic groups most similar to Scandinavians are French Canadian (98.5%, a difference of 0.0%), French (98.5%, a difference of 0.010%), European (98.5%, a difference of 0.010%), Czech (98.5%, a difference of 0.010%), and Croatian (98.5%, a difference of 0.020%).
| Demographics | Rating | Rank | 2nd Grade |
| Welsh | 100.0 /100 | #26 | Exceptional 98.5% |
| Croatians | 100.0 /100 | #27 | Exceptional 98.5% |
| Arapaho | 100.0 /100 | #28 | Exceptional 98.5% |
| French | 100.0 /100 | #29 | Exceptional 98.5% |
| Europeans | 100.0 /100 | #30 | Exceptional 98.5% |
| Czechs | 100.0 /100 | #31 | Exceptional 98.5% |
| French Canadians | 100.0 /100 | #32 | Exceptional 98.5% |
| Scandinavians | 100.0 /100 | #33 | Exceptional 98.5% |
| Chinese | 100.0 /100 | #34 | Exceptional 98.5% |
| Swiss | 100.0 /100 | #35 | Exceptional 98.5% |
| British | 100.0 /100 | #36 | Exceptional 98.5% |
| Italians | 99.9 /100 | #37 | Exceptional 98.4% |
| Latvians | 99.9 /100 | #38 | Exceptional 98.4% |
| Chippewa | 99.9 /100 | #39 | Exceptional 98.4% |
| Luxembourgers | 99.9 /100 | #40 | Exceptional 98.4% |