Immigrants from Oceania vs Scandinavian 2nd Grade
COMPARE
Immigrants from Oceania
Scandinavian
2nd Grade
2nd Grade Comparison
Immigrants from Oceania
Scandinavians
97.7%
2ND GRADE
10.9/ 100
METRIC RATING
209th/ 347
METRIC RANK
98.5%
2ND GRADE
100.0/ 100
METRIC RATING
33rd/ 347
METRIC RANK
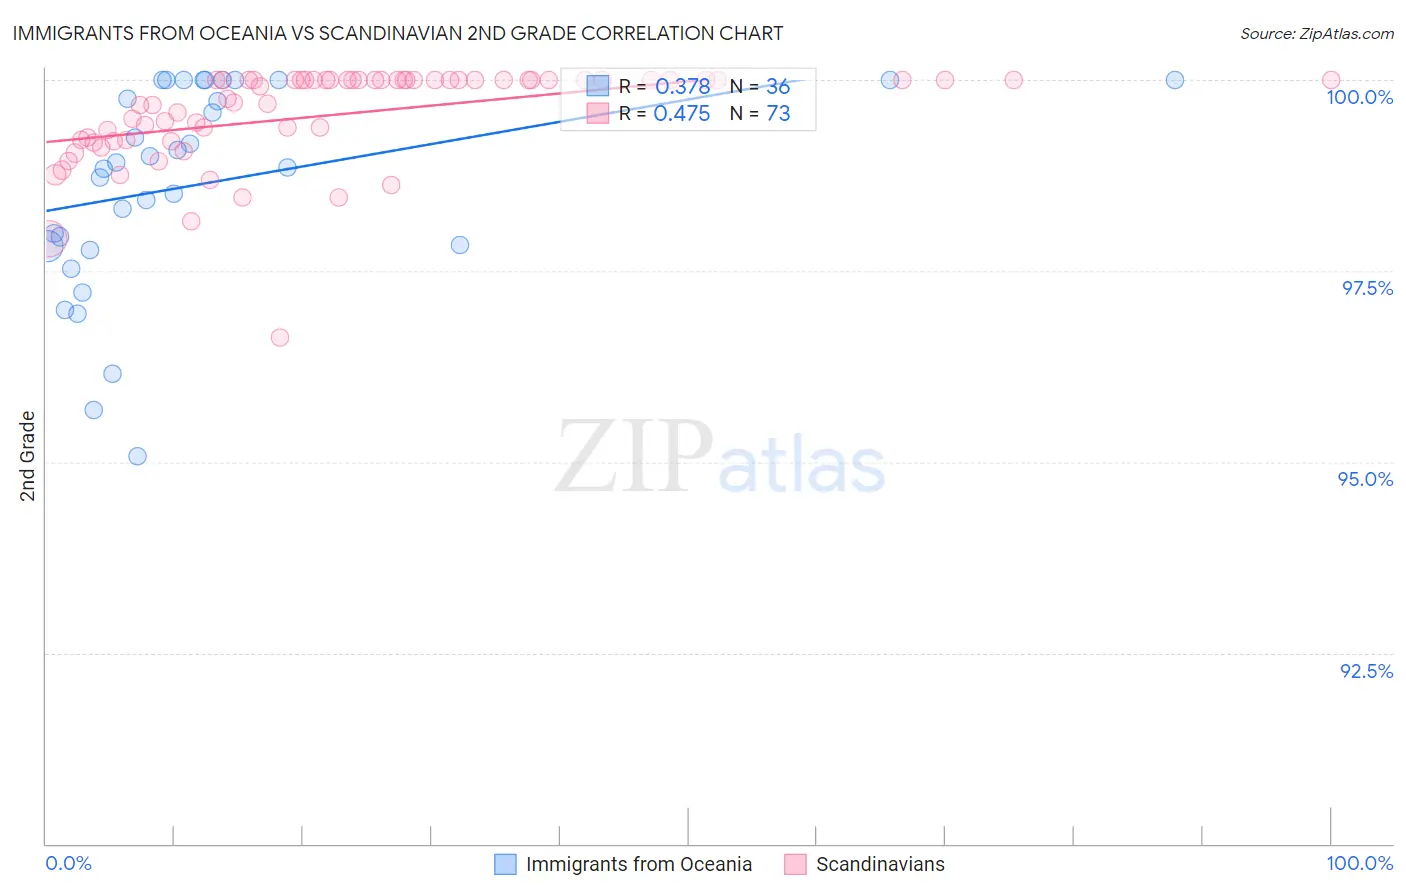
Immigrants from Oceania vs Scandinavian 2nd Grade Correlation Chart
The statistical analysis conducted on geographies consisting of 305,516,300 people shows a mild positive correlation between the proportion of Immigrants from Oceania and percentage of population with at least 2nd grade education in the United States with a correlation coefficient (R) of 0.378 and weighted average of 97.7%. Similarly, the statistical analysis conducted on geographies consisting of 472,660,430 people shows a moderate positive correlation between the proportion of Scandinavians and percentage of population with at least 2nd grade education in the United States with a correlation coefficient (R) of 0.475 and weighted average of 98.5%, a difference of 0.82%.
2nd Grade Correlation Summary
| Measurement | Immigrants from Oceania | Scandinavian |
| Minimum | 95.1% | 96.6% |
| Maximum | 100.0% | 100.0% |
| Range | 4.9% | 3.4% |
| Mean | 98.6% | 99.5% |
| Median | 98.9% | 100.0% |
| Interquartile 25% (IQ1) | 97.8% | 99.2% |
| Interquartile 75% (IQ3) | 100.0% | 100.0% |
| Interquartile Range (IQR) | 2.2% | 0.79% |
| Standard Deviation (Sample) | 1.3% | 0.63% |
| Standard Deviation (Population) | 1.3% | 0.63% |
Similar Demographics by 2nd Grade
Demographics Similar to Immigrants from Oceania by 2nd Grade
In terms of 2nd grade, the demographic groups most similar to Immigrants from Oceania are Costa Rican (97.7%, a difference of 0.0%), Immigrants from Northern Africa (97.7%, a difference of 0.010%), Laotian (97.7%, a difference of 0.010%), Immigrants from Bahamas (97.7%, a difference of 0.020%), and Moroccan (97.7%, a difference of 0.020%).
| Demographics | Rating | Rank | 2nd Grade |
| Immigrants | Ukraine | 20.5 /100 | #202 | Fair 97.8% |
| Yuman | 20.0 /100 | #203 | Fair 97.8% |
| Immigrants | Albania | 18.4 /100 | #204 | Poor 97.8% |
| Immigrants | Southern Europe | 18.1 /100 | #205 | Poor 97.8% |
| Immigrants | Chile | 17.3 /100 | #206 | Poor 97.7% |
| Africans | 15.6 /100 | #207 | Poor 97.7% |
| Immigrants | Northern Africa | 12.3 /100 | #208 | Poor 97.7% |
| Immigrants | Oceania | 10.9 /100 | #209 | Poor 97.7% |
| Costa Ricans | 10.5 /100 | #210 | Poor 97.7% |
| Laotians | 9.9 /100 | #211 | Tragic 97.7% |
| Immigrants | Bahamas | 8.4 /100 | #212 | Tragic 97.7% |
| Moroccans | 8.2 /100 | #213 | Tragic 97.7% |
| Samoans | 7.1 /100 | #214 | Tragic 97.7% |
| Bahamians | 6.8 /100 | #215 | Tragic 97.7% |
| South American Indians | 6.7 /100 | #216 | Tragic 97.7% |
Demographics Similar to Scandinavians by 2nd Grade
In terms of 2nd grade, the demographic groups most similar to Scandinavians are French Canadian (98.5%, a difference of 0.0%), French (98.5%, a difference of 0.010%), European (98.5%, a difference of 0.010%), Czech (98.5%, a difference of 0.010%), and Croatian (98.5%, a difference of 0.020%).
| Demographics | Rating | Rank | 2nd Grade |
| Welsh | 100.0 /100 | #26 | Exceptional 98.5% |
| Croatians | 100.0 /100 | #27 | Exceptional 98.5% |
| Arapaho | 100.0 /100 | #28 | Exceptional 98.5% |
| French | 100.0 /100 | #29 | Exceptional 98.5% |
| Europeans | 100.0 /100 | #30 | Exceptional 98.5% |
| Czechs | 100.0 /100 | #31 | Exceptional 98.5% |
| French Canadians | 100.0 /100 | #32 | Exceptional 98.5% |
| Scandinavians | 100.0 /100 | #33 | Exceptional 98.5% |
| Chinese | 100.0 /100 | #34 | Exceptional 98.5% |
| Swiss | 100.0 /100 | #35 | Exceptional 98.5% |
| British | 100.0 /100 | #36 | Exceptional 98.5% |
| Italians | 99.9 /100 | #37 | Exceptional 98.4% |
| Latvians | 99.9 /100 | #38 | Exceptional 98.4% |
| Chippewa | 99.9 /100 | #39 | Exceptional 98.4% |
| Luxembourgers | 99.9 /100 | #40 | Exceptional 98.4% |