Immigrants from Venezuela vs Scandinavian Disability Age 35 to 64
COMPARE
Immigrants from Venezuela
Scandinavian
Disability Age 35 to 64
Disability Age 35 to 64 Comparison
Immigrants from Venezuela
Scandinavians
9.3%
DISABILITY AGE 35 TO 64
100.0/ 100
METRIC RATING
19th/ 347
METRIC RANK
11.9%
DISABILITY AGE 35 TO 64
6.4/ 100
METRIC RATING
226th/ 347
METRIC RANK
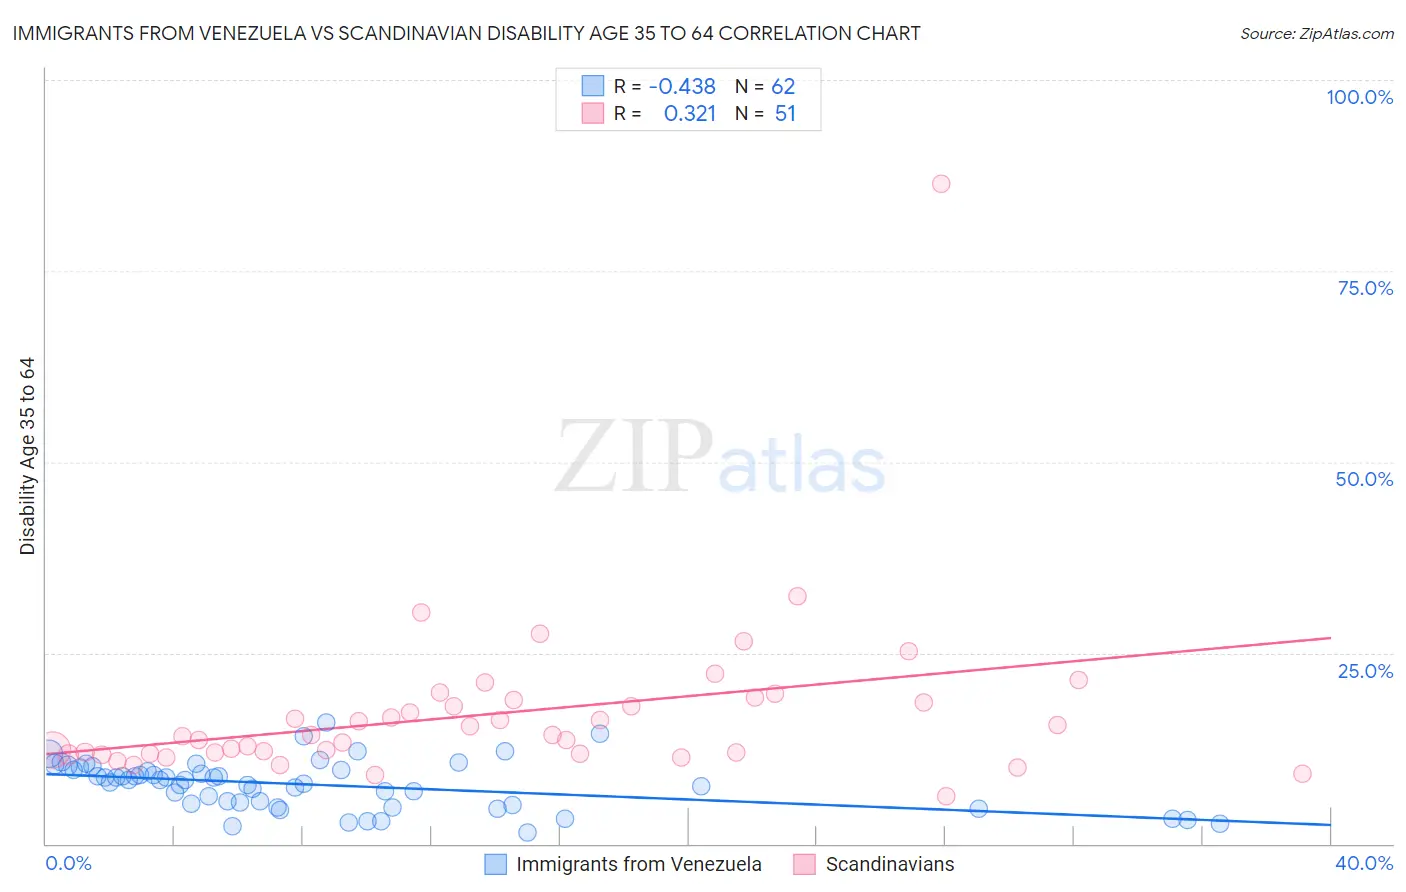
Immigrants from Venezuela vs Scandinavian Disability Age 35 to 64 Correlation Chart
The statistical analysis conducted on geographies consisting of 287,770,469 people shows a moderate negative correlation between the proportion of Immigrants from Venezuela and percentage of population with a disability between the ages 34 and 64 in the United States with a correlation coefficient (R) of -0.438 and weighted average of 9.3%. Similarly, the statistical analysis conducted on geographies consisting of 472,157,412 people shows a mild positive correlation between the proportion of Scandinavians and percentage of population with a disability between the ages 34 and 64 in the United States with a correlation coefficient (R) of 0.321 and weighted average of 11.9%, a difference of 28.1%.
Disability Age 35 to 64 Correlation Summary
| Measurement | Immigrants from Venezuela | Scandinavian |
| Minimum | 1.5% | 6.2% |
| Maximum | 15.9% | 86.4% |
| Range | 14.3% | 80.1% |
| Mean | 7.7% | 17.1% |
| Median | 8.3% | 14.2% |
| Interquartile 25% (IQ1) | 5.2% | 11.8% |
| Interquartile 75% (IQ3) | 9.7% | 18.8% |
| Interquartile Range (IQR) | 4.5% | 6.9% |
| Standard Deviation (Sample) | 3.1% | 11.3% |
| Standard Deviation (Population) | 3.1% | 11.2% |
Similar Demographics by Disability Age 35 to 64
Demographics Similar to Immigrants from Venezuela by Disability Age 35 to 64
In terms of disability age 35 to 64, the demographic groups most similar to Immigrants from Venezuela are Soviet Union (9.2%, a difference of 0.24%), Immigrants from Argentina (9.3%, a difference of 0.51%), Burmese (9.2%, a difference of 0.65%), Okinawan (9.4%, a difference of 0.94%), and Cypriot (9.4%, a difference of 0.97%).
| Demographics | Rating | Rank | Disability Age 35 to 64 |
| Indians (Asian) | 100.0 /100 | #12 | Exceptional 8.9% |
| Immigrants | South Central Asia | 100.0 /100 | #13 | Exceptional 8.9% |
| Immigrants | Singapore | 100.0 /100 | #14 | Exceptional 8.9% |
| Bolivians | 100.0 /100 | #15 | Exceptional 8.9% |
| Immigrants | Korea | 100.0 /100 | #16 | Exceptional 9.0% |
| Burmese | 100.0 /100 | #17 | Exceptional 9.2% |
| Soviet Union | 100.0 /100 | #18 | Exceptional 9.2% |
| Immigrants | Venezuela | 100.0 /100 | #19 | Exceptional 9.3% |
| Immigrants | Argentina | 100.0 /100 | #20 | Exceptional 9.3% |
| Okinawans | 100.0 /100 | #21 | Exceptional 9.4% |
| Cypriots | 100.0 /100 | #22 | Exceptional 9.4% |
| Argentineans | 100.0 /100 | #23 | Exceptional 9.4% |
| Asians | 100.0 /100 | #24 | Exceptional 9.4% |
| Venezuelans | 100.0 /100 | #25 | Exceptional 9.4% |
| Immigrants | Sri Lanka | 100.0 /100 | #26 | Exceptional 9.5% |
Demographics Similar to Scandinavians by Disability Age 35 to 64
In terms of disability age 35 to 64, the demographic groups most similar to Scandinavians are Immigrants from Central America (11.9%, a difference of 0.030%), Immigrants from Germany (11.9%, a difference of 0.060%), Immigrants from Belize (11.9%, a difference of 0.080%), British West Indian (11.9%, a difference of 0.090%), and Panamanian (11.9%, a difference of 0.19%).
| Demographics | Rating | Rank | Disability Age 35 to 64 |
| Czechoslovakians | 9.0 /100 | #219 | Tragic 11.8% |
| Immigrants | West Indies | 8.9 /100 | #220 | Tragic 11.8% |
| Alsatians | 8.5 /100 | #221 | Tragic 11.8% |
| Hondurans | 8.4 /100 | #222 | Tragic 11.8% |
| Immigrants | Honduras | 8.4 /100 | #223 | Tragic 11.8% |
| Immigrants | Ghana | 7.8 /100 | #224 | Tragic 11.8% |
| Immigrants | Belize | 6.6 /100 | #225 | Tragic 11.9% |
| Scandinavians | 6.4 /100 | #226 | Tragic 11.9% |
| Immigrants | Central America | 6.3 /100 | #227 | Tragic 11.9% |
| Immigrants | Germany | 6.2 /100 | #228 | Tragic 11.9% |
| British West Indians | 6.1 /100 | #229 | Tragic 11.9% |
| Panamanians | 5.8 /100 | #230 | Tragic 11.9% |
| Jamaicans | 5.7 /100 | #231 | Tragic 11.9% |
| Sudanese | 5.3 /100 | #232 | Tragic 11.9% |
| Bermudans | 5.0 /100 | #233 | Tragic 11.9% |