Immigrants from Venezuela vs Immigrants from Singapore 11th Grade
COMPARE
Immigrants from Venezuela
Immigrants from Singapore
11th Grade
11th Grade Comparison
Immigrants from Venezuela
Immigrants from Singapore
92.7%
11TH GRADE
72.0/ 100
METRIC RATING
158th/ 347
METRIC RANK
94.2%
11TH GRADE
99.9/ 100
METRIC RATING
35th/ 347
METRIC RANK
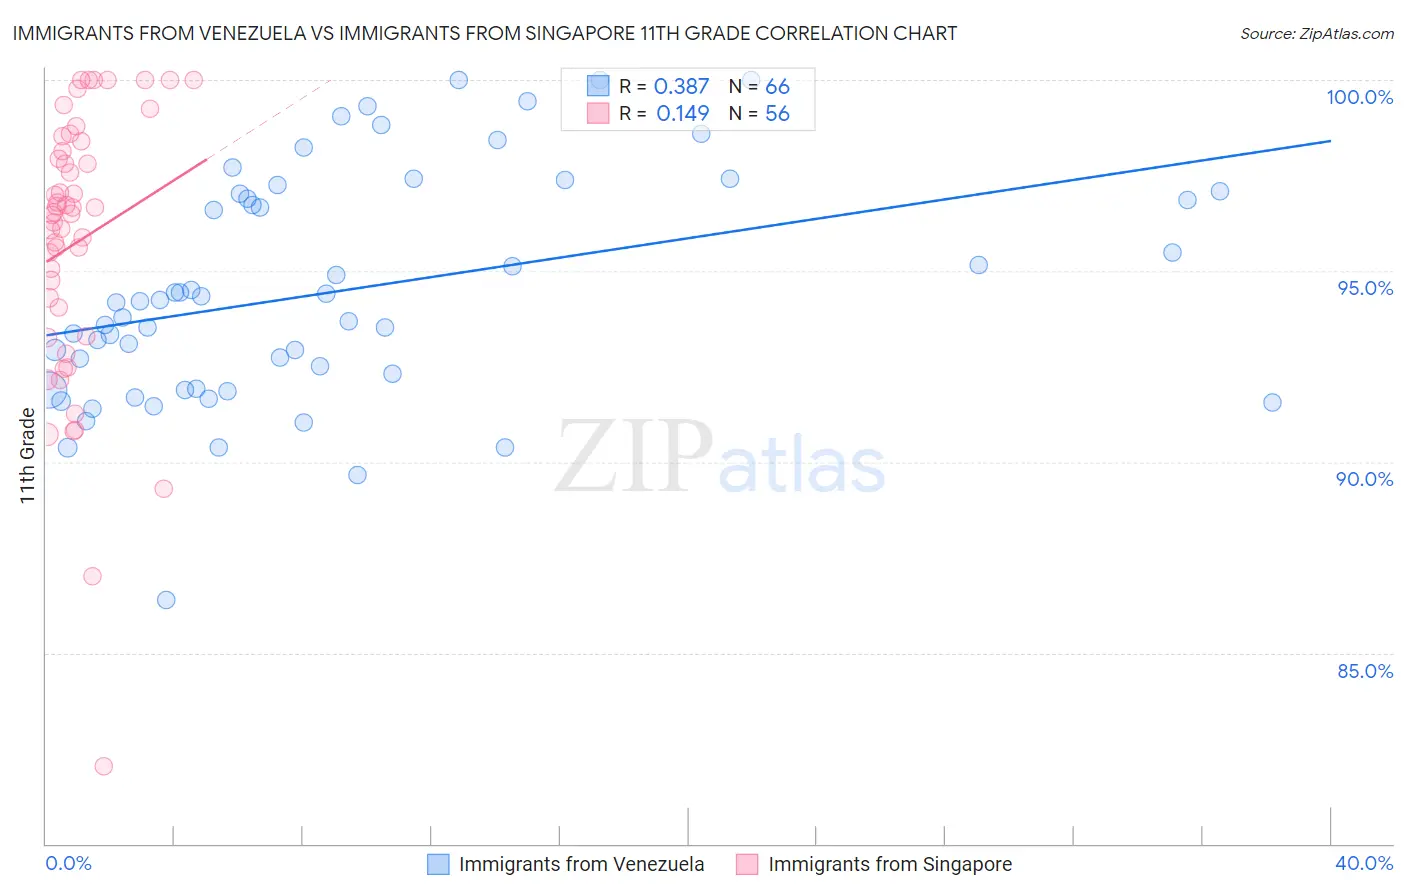
Immigrants from Venezuela vs Immigrants from Singapore 11th Grade Correlation Chart
The statistical analysis conducted on geographies consisting of 287,866,258 people shows a mild positive correlation between the proportion of Immigrants from Venezuela and percentage of population with at least 11th grade education in the United States with a correlation coefficient (R) of 0.387 and weighted average of 92.7%. Similarly, the statistical analysis conducted on geographies consisting of 137,521,094 people shows a poor positive correlation between the proportion of Immigrants from Singapore and percentage of population with at least 11th grade education in the United States with a correlation coefficient (R) of 0.149 and weighted average of 94.2%, a difference of 1.6%.
11th Grade Correlation Summary
| Measurement | Immigrants from Venezuela | Immigrants from Singapore |
| Minimum | 86.4% | 82.0% |
| Maximum | 100.0% | 100.0% |
| Range | 13.6% | 18.0% |
| Mean | 94.5% | 95.7% |
| Median | 94.2% | 96.5% |
| Interquartile 25% (IQ1) | 91.9% | 93.7% |
| Interquartile 75% (IQ3) | 97.0% | 98.3% |
| Interquartile Range (IQR) | 5.1% | 4.6% |
| Standard Deviation (Sample) | 3.0% | 3.6% |
| Standard Deviation (Population) | 3.0% | 3.6% |
Similar Demographics by 11th Grade
Demographics Similar to Immigrants from Venezuela by 11th Grade
In terms of 11th grade, the demographic groups most similar to Immigrants from Venezuela are American (92.7%, a difference of 0.0%), Immigrants from Spain (92.7%, a difference of 0.010%), Immigrants from Eastern Asia (92.7%, a difference of 0.010%), Brazilian (92.8%, a difference of 0.020%), and Osage (92.7%, a difference of 0.020%).
| Demographics | Rating | Rank | 11th Grade |
| Potawatomi | 74.3 /100 | #151 | Good 92.8% |
| Iraqis | 74.2 /100 | #152 | Good 92.8% |
| Brazilians | 73.9 /100 | #153 | Good 92.8% |
| Osage | 73.4 /100 | #154 | Good 92.7% |
| Argentineans | 73.4 /100 | #155 | Good 92.7% |
| Immigrants | Spain | 73.0 /100 | #156 | Good 92.7% |
| Immigrants | Eastern Asia | 72.6 /100 | #157 | Good 92.7% |
| Immigrants | Venezuela | 72.0 /100 | #158 | Good 92.7% |
| Americans | 71.7 /100 | #159 | Good 92.7% |
| Immigrants | Lebanon | 70.7 /100 | #160 | Good 92.7% |
| Immigrants | Argentina | 69.8 /100 | #161 | Good 92.7% |
| Paraguayans | 68.7 /100 | #162 | Good 92.7% |
| Immigrants | Nonimmigrants | 66.6 /100 | #163 | Good 92.7% |
| Spanish | 66.2 /100 | #164 | Good 92.7% |
| Immigrants | Iraq | 63.7 /100 | #165 | Good 92.6% |
Demographics Similar to Immigrants from Singapore by 11th Grade
In terms of 11th grade, the demographic groups most similar to Immigrants from Singapore are Immigrants from Northern Europe (94.2%, a difference of 0.0%), British (94.2%, a difference of 0.010%), Immigrants from Scotland (94.2%, a difference of 0.010%), Northern European (94.2%, a difference of 0.010%), and Hungarian (94.2%, a difference of 0.010%).
| Demographics | Rating | Rank | 11th Grade |
| Estonians | 100.0 /100 | #28 | Exceptional 94.4% |
| Dutch | 100.0 /100 | #29 | Exceptional 94.3% |
| Russians | 100.0 /100 | #30 | Exceptional 94.3% |
| Welsh | 99.9 /100 | #31 | Exceptional 94.2% |
| Belgians | 99.9 /100 | #32 | Exceptional 94.2% |
| British | 99.9 /100 | #33 | Exceptional 94.2% |
| Immigrants | Scotland | 99.9 /100 | #34 | Exceptional 94.2% |
| Immigrants | Singapore | 99.9 /100 | #35 | Exceptional 94.2% |
| Immigrants | Northern Europe | 99.9 /100 | #36 | Exceptional 94.2% |
| Northern Europeans | 99.9 /100 | #37 | Exceptional 94.2% |
| Hungarians | 99.9 /100 | #38 | Exceptional 94.2% |
| Immigrants | Lithuania | 99.9 /100 | #39 | Exceptional 94.1% |
| Thais | 99.9 /100 | #40 | Exceptional 94.1% |
| Cypriots | 99.9 /100 | #41 | Exceptional 94.1% |
| Immigrants | Austria | 99.9 /100 | #42 | Exceptional 94.1% |