Immigrants from Venezuela vs Liberian 11th Grade
COMPARE
Immigrants from Venezuela
Liberian
11th Grade
11th Grade Comparison
Immigrants from Venezuela
Liberians
92.7%
11TH GRADE
72.0/ 100
METRIC RATING
158th/ 347
METRIC RANK
92.3%
11TH GRADE
26.8/ 100
METRIC RATING
195th/ 347
METRIC RANK
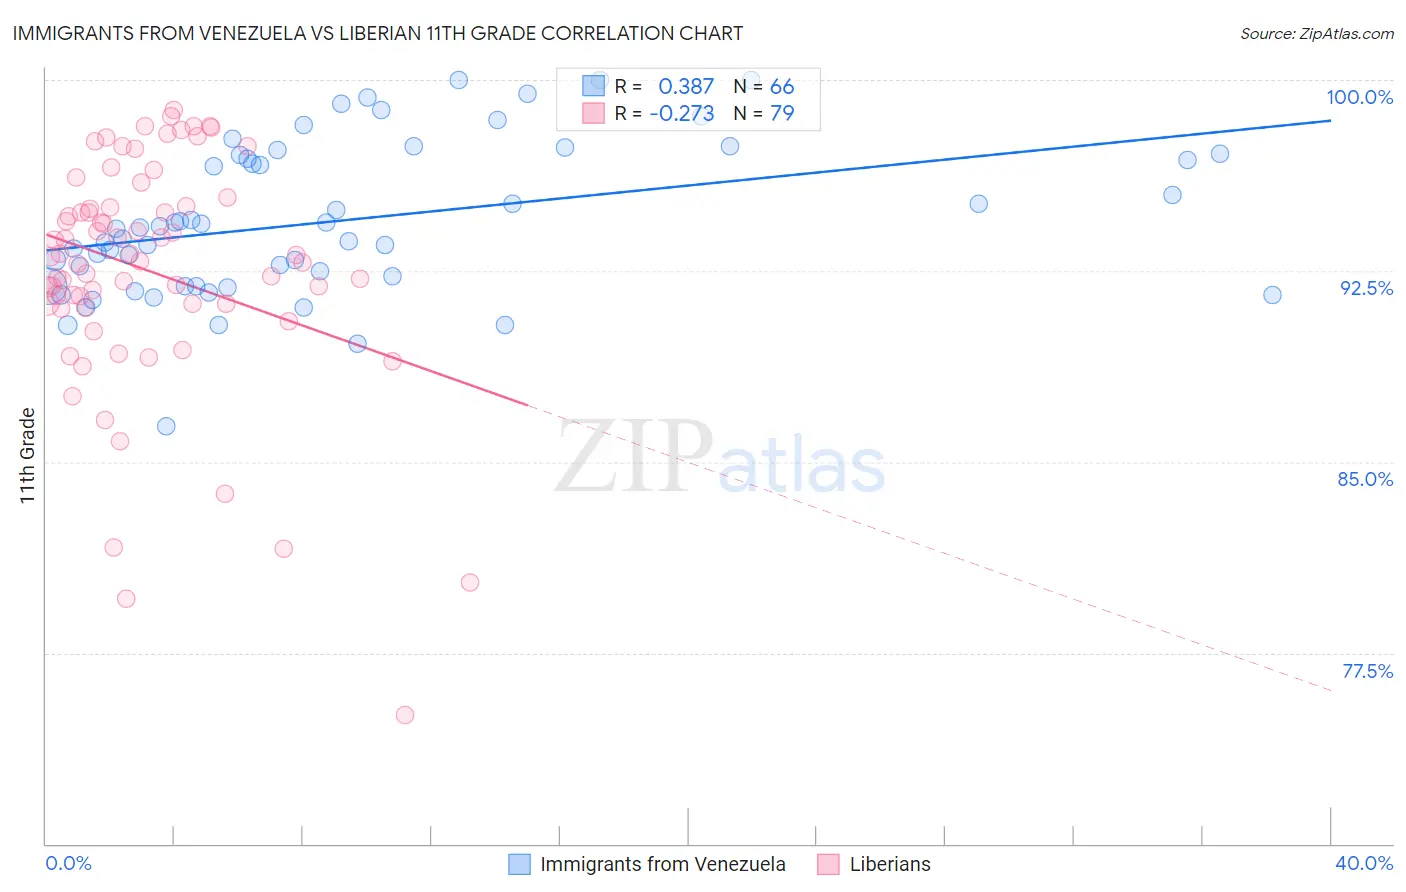
Immigrants from Venezuela vs Liberian 11th Grade Correlation Chart
The statistical analysis conducted on geographies consisting of 287,866,258 people shows a mild positive correlation between the proportion of Immigrants from Venezuela and percentage of population with at least 11th grade education in the United States with a correlation coefficient (R) of 0.387 and weighted average of 92.7%. Similarly, the statistical analysis conducted on geographies consisting of 118,101,728 people shows a weak negative correlation between the proportion of Liberians and percentage of population with at least 11th grade education in the United States with a correlation coefficient (R) of -0.273 and weighted average of 92.3%, a difference of 0.48%.
11th Grade Correlation Summary
| Measurement | Immigrants from Venezuela | Liberian |
| Minimum | 86.4% | 75.1% |
| Maximum | 100.0% | 98.8% |
| Range | 13.6% | 23.7% |
| Mean | 94.5% | 92.5% |
| Median | 94.2% | 93.1% |
| Interquartile 25% (IQ1) | 91.9% | 91.2% |
| Interquartile 75% (IQ3) | 97.0% | 95.1% |
| Interquartile Range (IQR) | 5.1% | 3.8% |
| Standard Deviation (Sample) | 3.0% | 4.6% |
| Standard Deviation (Population) | 3.0% | 4.6% |
Similar Demographics by 11th Grade
Demographics Similar to Immigrants from Venezuela by 11th Grade
In terms of 11th grade, the demographic groups most similar to Immigrants from Venezuela are American (92.7%, a difference of 0.0%), Immigrants from Spain (92.7%, a difference of 0.010%), Immigrants from Eastern Asia (92.7%, a difference of 0.010%), Brazilian (92.8%, a difference of 0.020%), and Osage (92.7%, a difference of 0.020%).
| Demographics | Rating | Rank | 11th Grade |
| Potawatomi | 74.3 /100 | #151 | Good 92.8% |
| Iraqis | 74.2 /100 | #152 | Good 92.8% |
| Brazilians | 73.9 /100 | #153 | Good 92.8% |
| Osage | 73.4 /100 | #154 | Good 92.7% |
| Argentineans | 73.4 /100 | #155 | Good 92.7% |
| Immigrants | Spain | 73.0 /100 | #156 | Good 92.7% |
| Immigrants | Eastern Asia | 72.6 /100 | #157 | Good 92.7% |
| Immigrants | Venezuela | 72.0 /100 | #158 | Good 92.7% |
| Americans | 71.7 /100 | #159 | Good 92.7% |
| Immigrants | Lebanon | 70.7 /100 | #160 | Good 92.7% |
| Immigrants | Argentina | 69.8 /100 | #161 | Good 92.7% |
| Paraguayans | 68.7 /100 | #162 | Good 92.7% |
| Immigrants | Nonimmigrants | 66.6 /100 | #163 | Good 92.7% |
| Spanish | 66.2 /100 | #164 | Good 92.7% |
| Immigrants | Iraq | 63.7 /100 | #165 | Good 92.6% |
Demographics Similar to Liberians by 11th Grade
In terms of 11th grade, the demographic groups most similar to Liberians are Panamanian (92.3%, a difference of 0.010%), Marshallese (92.3%, a difference of 0.010%), Moroccan (92.3%, a difference of 0.020%), Sioux (92.3%, a difference of 0.020%), and Hawaiian (92.3%, a difference of 0.020%).
| Demographics | Rating | Rank | 11th Grade |
| Immigrants | Indonesia | 33.7 /100 | #188 | Fair 92.4% |
| Immigrants | Chile | 33.3 /100 | #189 | Fair 92.4% |
| Chickasaw | 31.4 /100 | #190 | Fair 92.3% |
| French American Indians | 30.8 /100 | #191 | Fair 92.3% |
| Immigrants | Syria | 30.4 /100 | #192 | Fair 92.3% |
| Moroccans | 28.7 /100 | #193 | Fair 92.3% |
| Sioux | 28.5 /100 | #194 | Fair 92.3% |
| Liberians | 26.8 /100 | #195 | Fair 92.3% |
| Panamanians | 26.4 /100 | #196 | Fair 92.3% |
| Marshallese | 26.0 /100 | #197 | Fair 92.3% |
| Hawaiians | 25.5 /100 | #198 | Fair 92.3% |
| Immigrants | Uganda | 25.2 /100 | #199 | Fair 92.3% |
| Samoans | 25.1 /100 | #200 | Fair 92.3% |
| Immigrants | China | 25.1 /100 | #201 | Fair 92.3% |
| Immigrants | Eastern Africa | 24.1 /100 | #202 | Fair 92.3% |