Honduran vs Immigrants from Singapore 11th Grade
COMPARE
Honduran
Immigrants from Singapore
11th Grade
11th Grade Comparison
Hondurans
Immigrants from Singapore
87.4%
11TH GRADE
0.0/ 100
METRIC RATING
330th/ 347
METRIC RANK
94.2%
11TH GRADE
99.9/ 100
METRIC RATING
35th/ 347
METRIC RANK
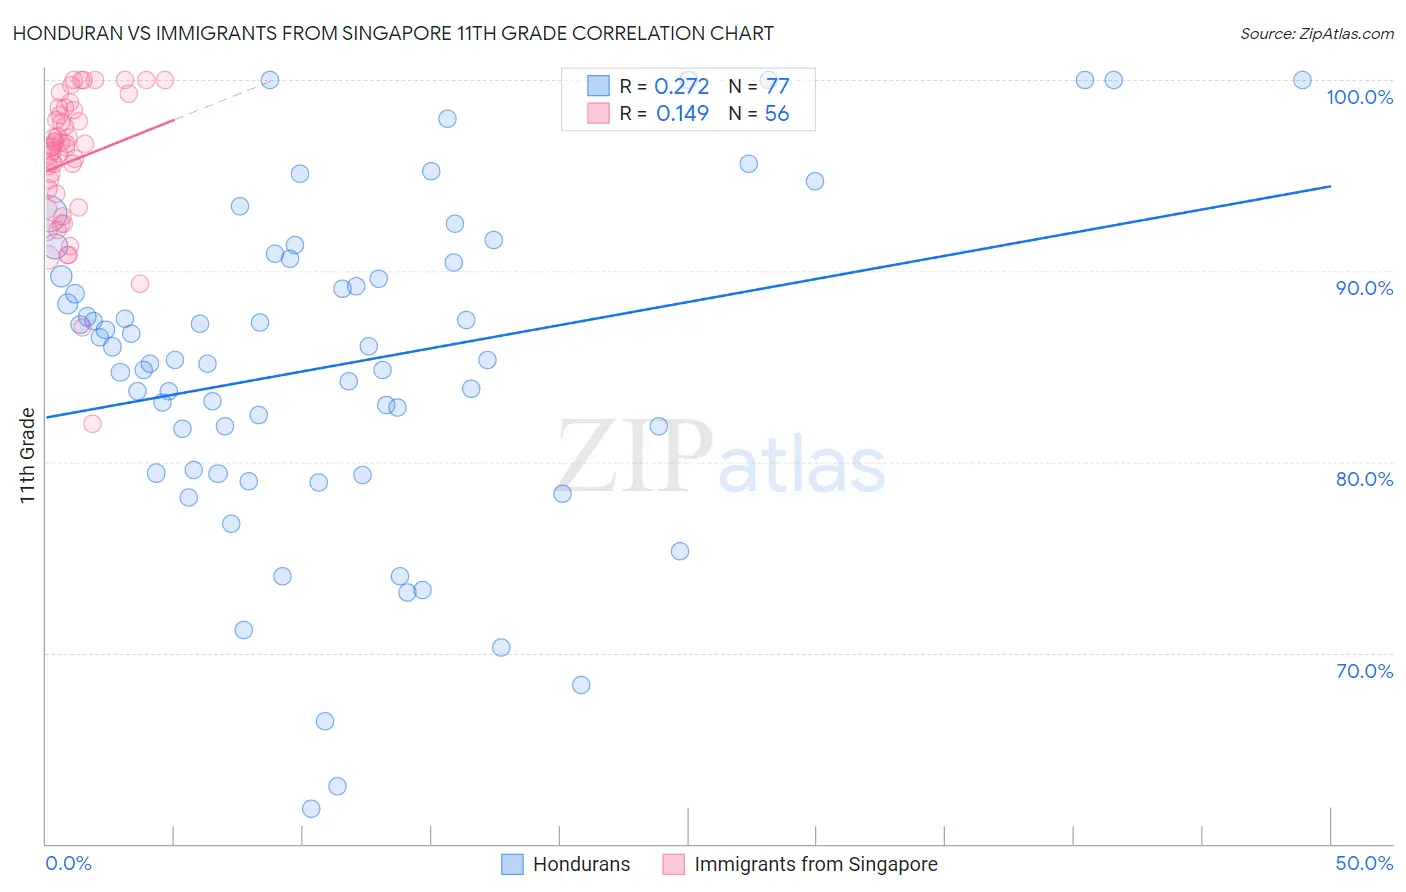
Honduran vs Immigrants from Singapore 11th Grade Correlation Chart
The statistical analysis conducted on geographies consisting of 357,858,827 people shows a weak positive correlation between the proportion of Hondurans and percentage of population with at least 11th grade education in the United States with a correlation coefficient (R) of 0.272 and weighted average of 87.4%. Similarly, the statistical analysis conducted on geographies consisting of 137,521,094 people shows a poor positive correlation between the proportion of Immigrants from Singapore and percentage of population with at least 11th grade education in the United States with a correlation coefficient (R) of 0.149 and weighted average of 94.2%, a difference of 7.8%.
11th Grade Correlation Summary
| Measurement | Honduran | Immigrants from Singapore |
| Minimum | 61.9% | 82.0% |
| Maximum | 100.0% | 100.0% |
| Range | 38.1% | 18.0% |
| Mean | 85.1% | 95.7% |
| Median | 85.4% | 96.5% |
| Interquartile 25% (IQ1) | 79.5% | 93.7% |
| Interquartile 75% (IQ3) | 90.5% | 98.3% |
| Interquartile Range (IQR) | 11.0% | 4.6% |
| Standard Deviation (Sample) | 8.6% | 3.6% |
| Standard Deviation (Population) | 8.5% | 3.6% |
Similar Demographics by 11th Grade
Demographics Similar to Hondurans by 11th Grade
In terms of 11th grade, the demographic groups most similar to Hondurans are Hispanic or Latino (87.3%, a difference of 0.060%), Immigrants from the Azores (87.2%, a difference of 0.16%), Mexican American Indian (87.5%, a difference of 0.19%), Tohono O'odham (87.6%, a difference of 0.26%), and Immigrants from Cabo Verde (87.6%, a difference of 0.31%).
| Demographics | Rating | Rank | 11th Grade |
| Pima | 0.0 /100 | #323 | Tragic 88.3% |
| Central American Indians | 0.0 /100 | #324 | Tragic 88.2% |
| Immigrants | Nicaragua | 0.0 /100 | #325 | Tragic 88.1% |
| Dominicans | 0.0 /100 | #326 | Tragic 87.7% |
| Immigrants | Cabo Verde | 0.0 /100 | #327 | Tragic 87.6% |
| Tohono O'odham | 0.0 /100 | #328 | Tragic 87.6% |
| Mexican American Indians | 0.0 /100 | #329 | Tragic 87.5% |
| Hondurans | 0.0 /100 | #330 | Tragic 87.4% |
| Hispanics or Latinos | 0.0 /100 | #331 | Tragic 87.3% |
| Immigrants | Azores | 0.0 /100 | #332 | Tragic 87.2% |
| Immigrants | Yemen | 0.0 /100 | #333 | Tragic 87.1% |
| Houma | 0.0 /100 | #334 | Tragic 87.0% |
| Central Americans | 0.0 /100 | #335 | Tragic 86.9% |
| Immigrants | Dominican Republic | 0.0 /100 | #336 | Tragic 86.9% |
| Immigrants | Honduras | 0.0 /100 | #337 | Tragic 86.9% |
Demographics Similar to Immigrants from Singapore by 11th Grade
In terms of 11th grade, the demographic groups most similar to Immigrants from Singapore are Immigrants from Northern Europe (94.2%, a difference of 0.0%), British (94.2%, a difference of 0.010%), Immigrants from Scotland (94.2%, a difference of 0.010%), Northern European (94.2%, a difference of 0.010%), and Hungarian (94.2%, a difference of 0.010%).
| Demographics | Rating | Rank | 11th Grade |
| Estonians | 100.0 /100 | #28 | Exceptional 94.4% |
| Dutch | 100.0 /100 | #29 | Exceptional 94.3% |
| Russians | 100.0 /100 | #30 | Exceptional 94.3% |
| Welsh | 99.9 /100 | #31 | Exceptional 94.2% |
| Belgians | 99.9 /100 | #32 | Exceptional 94.2% |
| British | 99.9 /100 | #33 | Exceptional 94.2% |
| Immigrants | Scotland | 99.9 /100 | #34 | Exceptional 94.2% |
| Immigrants | Singapore | 99.9 /100 | #35 | Exceptional 94.2% |
| Immigrants | Northern Europe | 99.9 /100 | #36 | Exceptional 94.2% |
| Northern Europeans | 99.9 /100 | #37 | Exceptional 94.2% |
| Hungarians | 99.9 /100 | #38 | Exceptional 94.2% |
| Immigrants | Lithuania | 99.9 /100 | #39 | Exceptional 94.1% |
| Thais | 99.9 /100 | #40 | Exceptional 94.1% |
| Cypriots | 99.9 /100 | #41 | Exceptional 94.1% |
| Immigrants | Austria | 99.9 /100 | #42 | Exceptional 94.1% |