Immigrants from Venezuela vs Sudanese 11th Grade
COMPARE
Immigrants from Venezuela
Sudanese
11th Grade
11th Grade Comparison
Immigrants from Venezuela
Sudanese
92.7%
11TH GRADE
72.0/ 100
METRIC RATING
158th/ 347
METRIC RANK
92.5%
11TH GRADE
43.4/ 100
METRIC RATING
178th/ 347
METRIC RANK
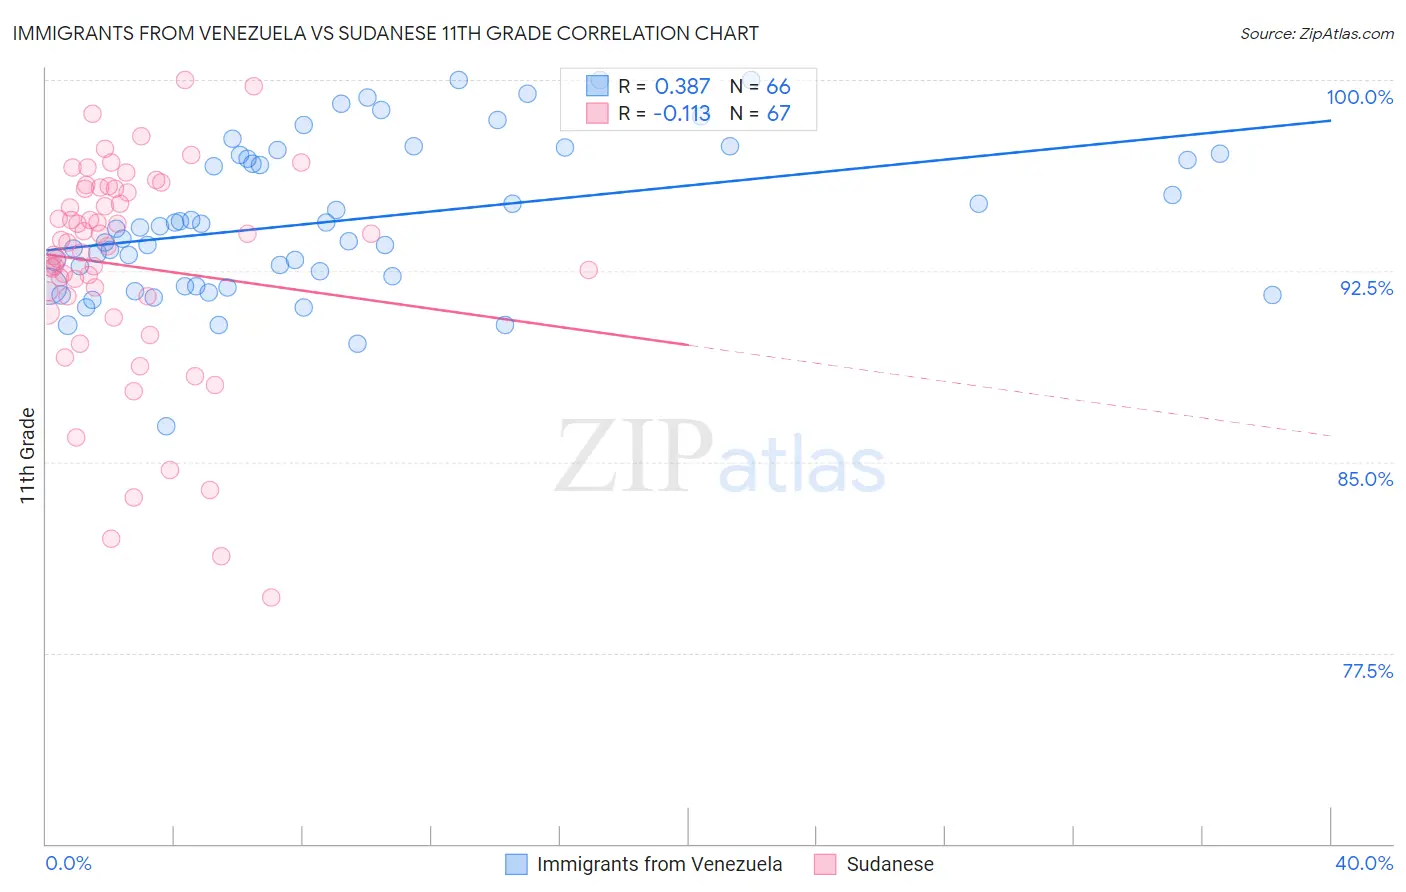
Immigrants from Venezuela vs Sudanese 11th Grade Correlation Chart
The statistical analysis conducted on geographies consisting of 287,866,258 people shows a mild positive correlation between the proportion of Immigrants from Venezuela and percentage of population with at least 11th grade education in the United States with a correlation coefficient (R) of 0.387 and weighted average of 92.7%. Similarly, the statistical analysis conducted on geographies consisting of 110,134,719 people shows a poor negative correlation between the proportion of Sudanese and percentage of population with at least 11th grade education in the United States with a correlation coefficient (R) of -0.113 and weighted average of 92.5%, a difference of 0.30%.
11th Grade Correlation Summary
| Measurement | Immigrants from Venezuela | Sudanese |
| Minimum | 86.4% | 79.7% |
| Maximum | 100.0% | 100.0% |
| Range | 13.6% | 20.3% |
| Mean | 94.5% | 92.7% |
| Median | 94.2% | 93.6% |
| Interquartile 25% (IQ1) | 91.9% | 91.5% |
| Interquartile 75% (IQ3) | 97.0% | 95.7% |
| Interquartile Range (IQR) | 5.1% | 4.2% |
| Standard Deviation (Sample) | 3.0% | 4.3% |
| Standard Deviation (Population) | 3.0% | 4.3% |
Demographics Similar to Immigrants from Venezuela and Sudanese by 11th Grade
In terms of 11th grade, the demographic groups most similar to Immigrants from Venezuela are American (92.7%, a difference of 0.0%), Immigrants from Lebanon (92.7%, a difference of 0.020%), Immigrants from Argentina (92.7%, a difference of 0.030%), Paraguayan (92.7%, a difference of 0.040%), and Nonimmigrants (92.7%, a difference of 0.060%). Similarly, the demographic groups most similar to Sudanese are Guamanian/Chamorro (92.5%, a difference of 0.020%), Spaniard (92.5%, a difference of 0.030%), Shoshone (92.5%, a difference of 0.060%), Asian (92.5%, a difference of 0.070%), and Indian (Asian) (92.5%, a difference of 0.080%).
| Demographics | Rating | Rank | 11th Grade |
| Immigrants | Venezuela | 72.0 /100 | #158 | Good 92.7% |
| Americans | 71.7 /100 | #159 | Good 92.7% |
| Immigrants | Lebanon | 70.7 /100 | #160 | Good 92.7% |
| Immigrants | Argentina | 69.8 /100 | #161 | Good 92.7% |
| Paraguayans | 68.7 /100 | #162 | Good 92.7% |
| Immigrants | Nonimmigrants | 66.6 /100 | #163 | Good 92.7% |
| Spanish | 66.2 /100 | #164 | Good 92.7% |
| Immigrants | Iraq | 63.7 /100 | #165 | Good 92.6% |
| Bermudans | 62.3 /100 | #166 | Good 92.6% |
| Alsatians | 60.2 /100 | #167 | Good 92.6% |
| Sierra Leoneans | 58.7 /100 | #168 | Average 92.6% |
| Immigrants | Albania | 57.8 /100 | #169 | Average 92.6% |
| Immigrants | Northern Africa | 57.3 /100 | #170 | Average 92.6% |
| Laotians | 54.4 /100 | #171 | Average 92.6% |
| Immigrants | Pakistan | 52.3 /100 | #172 | Average 92.5% |
| Indians (Asian) | 51.5 /100 | #173 | Average 92.5% |
| Asians | 50.0 /100 | #174 | Average 92.5% |
| Shoshone | 48.9 /100 | #175 | Average 92.5% |
| Spaniards | 46.9 /100 | #176 | Average 92.5% |
| Guamanians/Chamorros | 45.0 /100 | #177 | Average 92.5% |
| Sudanese | 43.4 /100 | #178 | Average 92.5% |