Immigrants from Pakistan vs Immigrants from Peru Nursery School
COMPARE
Immigrants from Pakistan
Immigrants from Peru
Nursery School
Nursery School Comparison
Immigrants from Pakistan
Immigrants from Peru
97.7%
NURSERY SCHOOL
2.1/ 100
METRIC RATING
235th/ 347
METRIC RANK
97.5%
NURSERY SCHOOL
0.2/ 100
METRIC RATING
271st/ 347
METRIC RANK
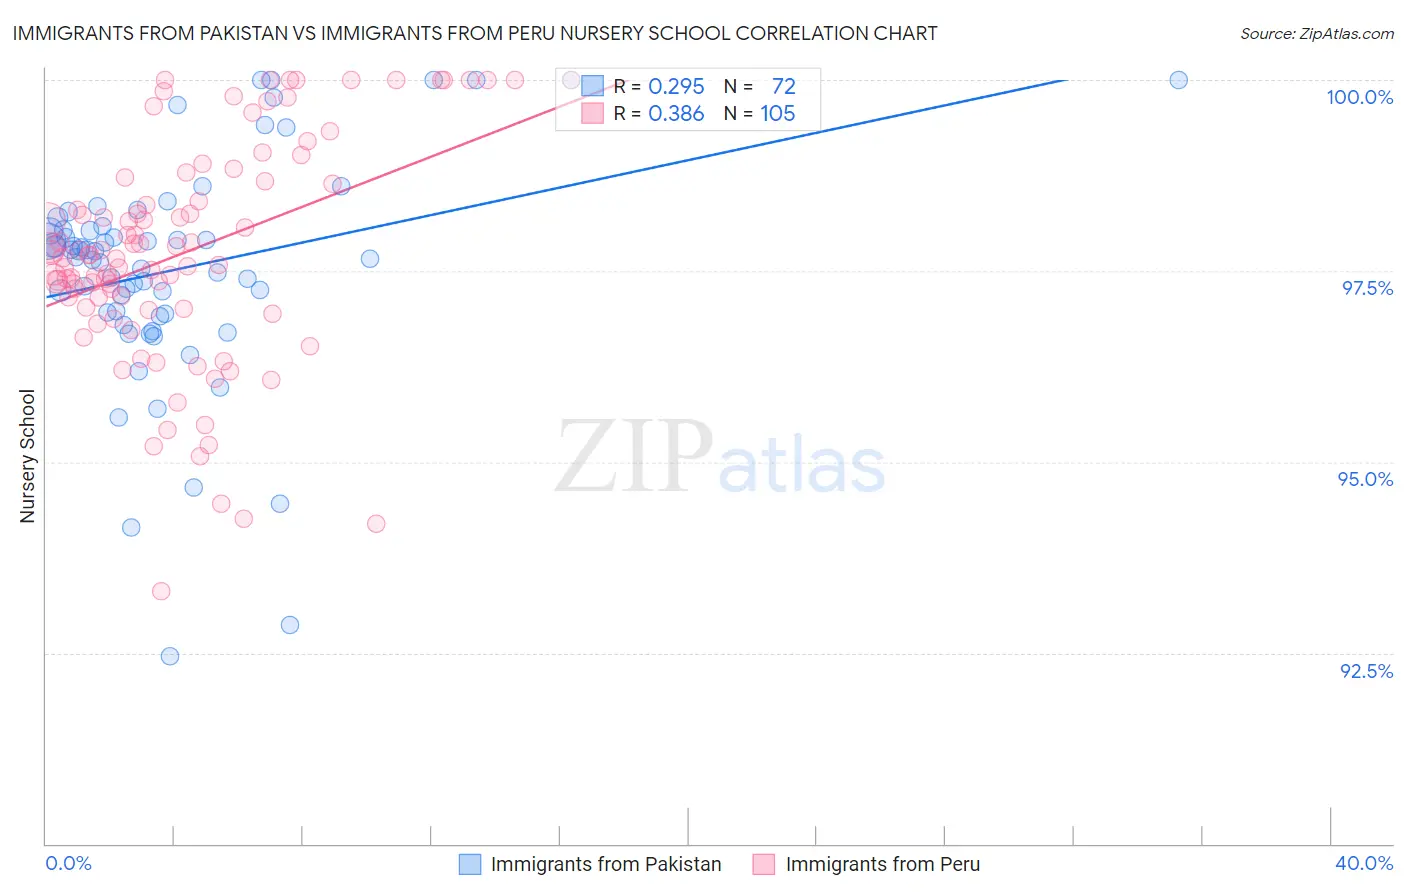
Immigrants from Pakistan vs Immigrants from Peru Nursery School Correlation Chart
The statistical analysis conducted on geographies consisting of 283,901,001 people shows a weak positive correlation between the proportion of Immigrants from Pakistan and percentage of population with at least nursery school education in the United States with a correlation coefficient (R) of 0.295 and weighted average of 97.7%. Similarly, the statistical analysis conducted on geographies consisting of 328,685,754 people shows a mild positive correlation between the proportion of Immigrants from Peru and percentage of population with at least nursery school education in the United States with a correlation coefficient (R) of 0.386 and weighted average of 97.5%, a difference of 0.19%.
Nursery School Correlation Summary
| Measurement | Immigrants from Pakistan | Immigrants from Peru |
| Minimum | 92.5% | 93.3% |
| Maximum | 100.0% | 100.0% |
| Range | 7.5% | 6.7% |
| Mean | 97.5% | 97.7% |
| Median | 97.7% | 97.7% |
| Interquartile 25% (IQ1) | 96.9% | 97.0% |
| Interquartile 75% (IQ3) | 98.1% | 98.7% |
| Interquartile Range (IQR) | 1.1% | 1.7% |
| Standard Deviation (Sample) | 1.5% | 1.5% |
| Standard Deviation (Population) | 1.5% | 1.5% |
Similar Demographics by Nursery School
Demographics Similar to Immigrants from Pakistan by Nursery School
In terms of nursery school, the demographic groups most similar to Immigrants from Pakistan are U.S. Virgin Islander (97.7%, a difference of 0.0%), Colombian (97.7%, a difference of 0.0%), Immigrants from Uruguay (97.7%, a difference of 0.010%), Immigrants from Malaysia (97.7%, a difference of 0.010%), and Immigrants from Western Asia (97.7%, a difference of 0.010%).
| Demographics | Rating | Rank | Nursery School |
| Sudanese | 3.2 /100 | #228 | Tragic 97.7% |
| Senegalese | 3.2 /100 | #229 | Tragic 97.7% |
| Sierra Leoneans | 2.9 /100 | #230 | Tragic 97.7% |
| Puerto Ricans | 2.6 /100 | #231 | Tragic 97.7% |
| Immigrants | Uruguay | 2.3 /100 | #232 | Tragic 97.7% |
| U.S. Virgin Islanders | 2.1 /100 | #233 | Tragic 97.7% |
| Colombians | 2.1 /100 | #234 | Tragic 97.7% |
| Immigrants | Pakistan | 2.1 /100 | #235 | Tragic 97.7% |
| Immigrants | Malaysia | 1.9 /100 | #236 | Tragic 97.7% |
| Immigrants | Western Asia | 1.9 /100 | #237 | Tragic 97.7% |
| Nigerians | 1.7 /100 | #238 | Tragic 97.7% |
| Immigrants | Eastern Asia | 1.6 /100 | #239 | Tragic 97.7% |
| Koreans | 1.4 /100 | #240 | Tragic 97.7% |
| Immigrants | Indonesia | 1.1 /100 | #241 | Tragic 97.7% |
| Liberians | 1.1 /100 | #242 | Tragic 97.7% |
Demographics Similar to Immigrants from Peru by Nursery School
In terms of nursery school, the demographic groups most similar to Immigrants from Peru are Immigrants from Jamaica (97.5%, a difference of 0.020%), Immigrants from Bolivia (97.5%, a difference of 0.020%), West Indian (97.5%, a difference of 0.030%), Immigrants from Liberia (97.5%, a difference of 0.030%), and Immigrants from Sierra Leone (97.6%, a difference of 0.040%).
| Demographics | Rating | Rank | Nursery School |
| Taiwanese | 0.3 /100 | #264 | Tragic 97.6% |
| Assyrians/Chaldeans/Syriacs | 0.3 /100 | #265 | Tragic 97.6% |
| Immigrants | Sierra Leone | 0.3 /100 | #266 | Tragic 97.6% |
| Immigrants | Nigeria | 0.3 /100 | #267 | Tragic 97.5% |
| West Indians | 0.3 /100 | #268 | Tragic 97.5% |
| Immigrants | Liberia | 0.3 /100 | #269 | Tragic 97.5% |
| Immigrants | Jamaica | 0.2 /100 | #270 | Tragic 97.5% |
| Immigrants | Peru | 0.2 /100 | #271 | Tragic 97.5% |
| Immigrants | Bolivia | 0.1 /100 | #272 | Tragic 97.5% |
| Immigrants | China | 0.1 /100 | #273 | Tragic 97.5% |
| Immigrants | Cameroon | 0.1 /100 | #274 | Tragic 97.5% |
| Ghanaians | 0.1 /100 | #275 | Tragic 97.5% |
| Immigrants | Philippines | 0.1 /100 | #276 | Tragic 97.5% |
| Immigrants | Western Africa | 0.1 /100 | #277 | Tragic 97.4% |
| Immigrants | Uzbekistan | 0.1 /100 | #278 | Tragic 97.4% |