Immigrants from Cambodia vs Dominican 10th Grade
COMPARE
Immigrants from Cambodia
Dominican
10th Grade
10th Grade Comparison
Immigrants from Cambodia
Dominicans
90.9%
10TH GRADE
0.0/ 100
METRIC RATING
311th/ 347
METRIC RANK
89.4%
10TH GRADE
0.0/ 100
METRIC RATING
329th/ 347
METRIC RANK
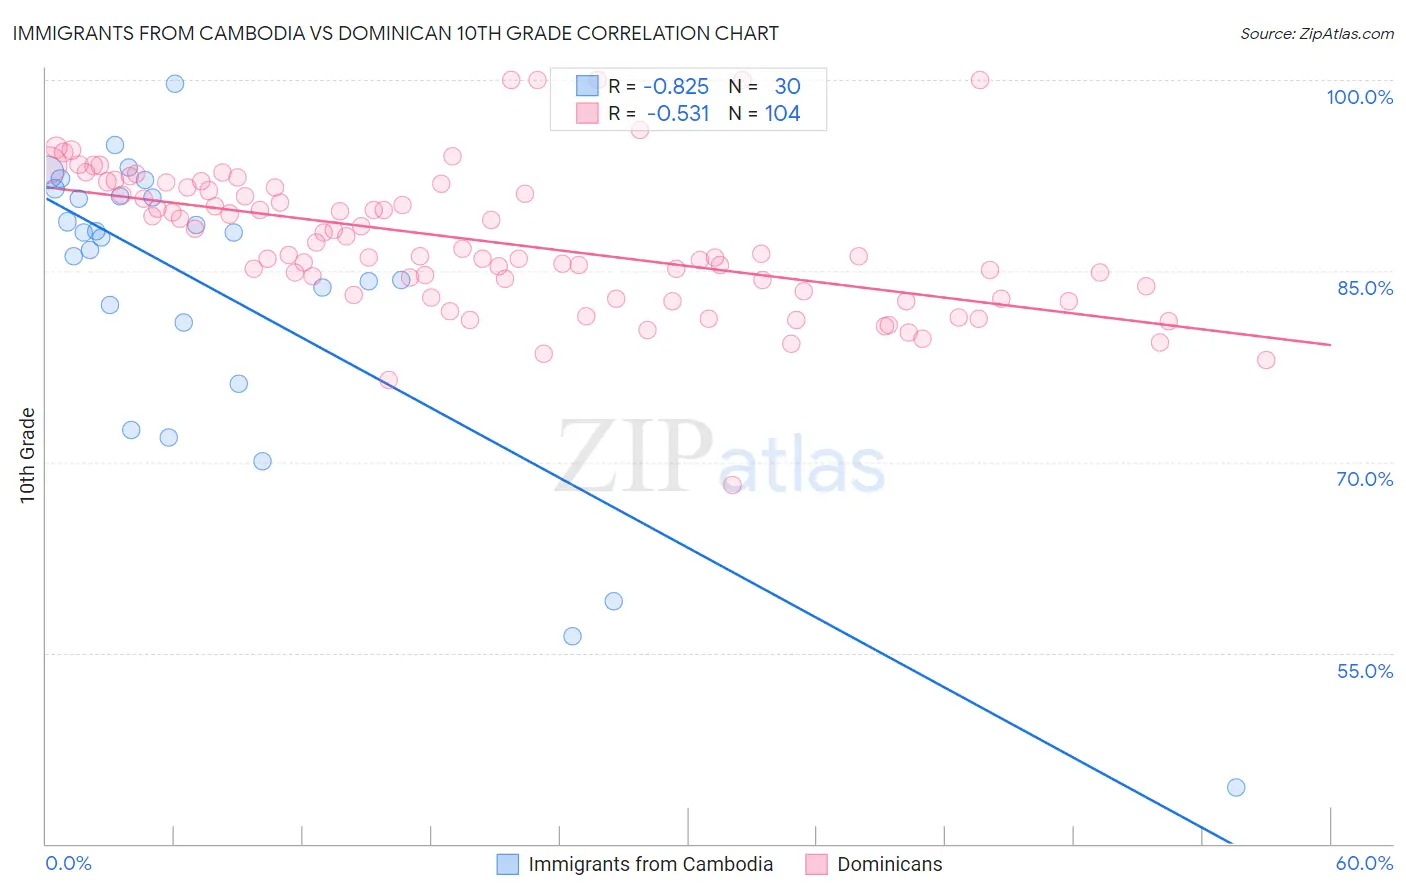
Immigrants from Cambodia vs Dominican 10th Grade Correlation Chart
The statistical analysis conducted on geographies consisting of 205,153,442 people shows a very strong negative correlation between the proportion of Immigrants from Cambodia and percentage of population with at least 10th grade education in the United States with a correlation coefficient (R) of -0.825 and weighted average of 90.9%. Similarly, the statistical analysis conducted on geographies consisting of 355,142,452 people shows a substantial negative correlation between the proportion of Dominicans and percentage of population with at least 10th grade education in the United States with a correlation coefficient (R) of -0.531 and weighted average of 89.4%, a difference of 1.8%.
10th Grade Correlation Summary
| Measurement | Immigrants from Cambodia | Dominican |
| Minimum | 44.4% | 68.1% |
| Maximum | 99.7% | 100.0% |
| Range | 55.2% | 31.9% |
| Mean | 83.2% | 87.3% |
| Median | 87.8% | 86.3% |
| Interquartile 25% (IQ1) | 80.9% | 83.2% |
| Interquartile 75% (IQ3) | 90.8% | 91.4% |
| Interquartile Range (IQR) | 9.9% | 8.2% |
| Standard Deviation (Sample) | 12.4% | 5.6% |
| Standard Deviation (Population) | 12.2% | 5.6% |
Demographics Similar to Immigrants from Cambodia and Dominicans by 10th Grade
In terms of 10th grade, the demographic groups most similar to Immigrants from Cambodia are Vietnamese (90.9%, a difference of 0.020%), Immigrants from Portugal (90.8%, a difference of 0.16%), Cape Verdean (90.8%, a difference of 0.19%), Nepalese (90.7%, a difference of 0.27%), and Immigrants from Caribbean (90.6%, a difference of 0.35%). Similarly, the demographic groups most similar to Dominicans are Immigrants from Cabo Verde (89.5%, a difference of 0.10%), Immigrants from Nicaragua (89.5%, a difference of 0.11%), Immigrants from Yemen (89.1%, a difference of 0.35%), Central American Indian (89.7%, a difference of 0.37%), and Puerto Rican (89.8%, a difference of 0.55%).
| Demographics | Rating | Rank | 10th Grade |
| Vietnamese | 0.0 /100 | #310 | Tragic 90.9% |
| Immigrants | Cambodia | 0.0 /100 | #311 | Tragic 90.9% |
| Immigrants | Portugal | 0.0 /100 | #312 | Tragic 90.8% |
| Cape Verdeans | 0.0 /100 | #313 | Tragic 90.8% |
| Nepalese | 0.0 /100 | #314 | Tragic 90.7% |
| Immigrants | Caribbean | 0.0 /100 | #315 | Tragic 90.6% |
| Ecuadorians | 0.0 /100 | #316 | Tragic 90.6% |
| Immigrants | Ecuador | 0.0 /100 | #317 | Tragic 90.4% |
| Immigrants | Cuba | 0.0 /100 | #318 | Tragic 90.2% |
| Nicaraguans | 0.0 /100 | #319 | Tragic 90.2% |
| Houma | 0.0 /100 | #320 | Tragic 90.2% |
| Belizeans | 0.0 /100 | #321 | Tragic 90.2% |
| Tohono O'odham | 0.0 /100 | #322 | Tragic 90.1% |
| Immigrants | Belize | 0.0 /100 | #323 | Tragic 90.1% |
| Immigrants | Armenia | 0.0 /100 | #324 | Tragic 89.9% |
| Puerto Ricans | 0.0 /100 | #325 | Tragic 89.8% |
| Central American Indians | 0.0 /100 | #326 | Tragic 89.7% |
| Immigrants | Nicaragua | 0.0 /100 | #327 | Tragic 89.5% |
| Immigrants | Cabo Verde | 0.0 /100 | #328 | Tragic 89.5% |
| Dominicans | 0.0 /100 | #329 | Tragic 89.4% |
| Immigrants | Yemen | 0.0 /100 | #330 | Tragic 89.1% |