Immigrants from Uruguay vs Immigrants from Uzbekistan Unemployment Among Ages 30 to 34 years
COMPARE
Immigrants from Uruguay
Immigrants from Uzbekistan
Unemployment Among Ages 30 to 34 years
Unemployment Among Ages 30 to 34 years Comparison
Immigrants from Uruguay
Immigrants from Uzbekistan
5.3%
UNEMPLOYMENT AMONG AGES 30 TO 34 YEARS
79.3/ 100
METRIC RATING
128th/ 347
METRIC RANK
5.9%
UNEMPLOYMENT AMONG AGES 30 TO 34 YEARS
1.5/ 100
METRIC RATING
229th/ 347
METRIC RANK
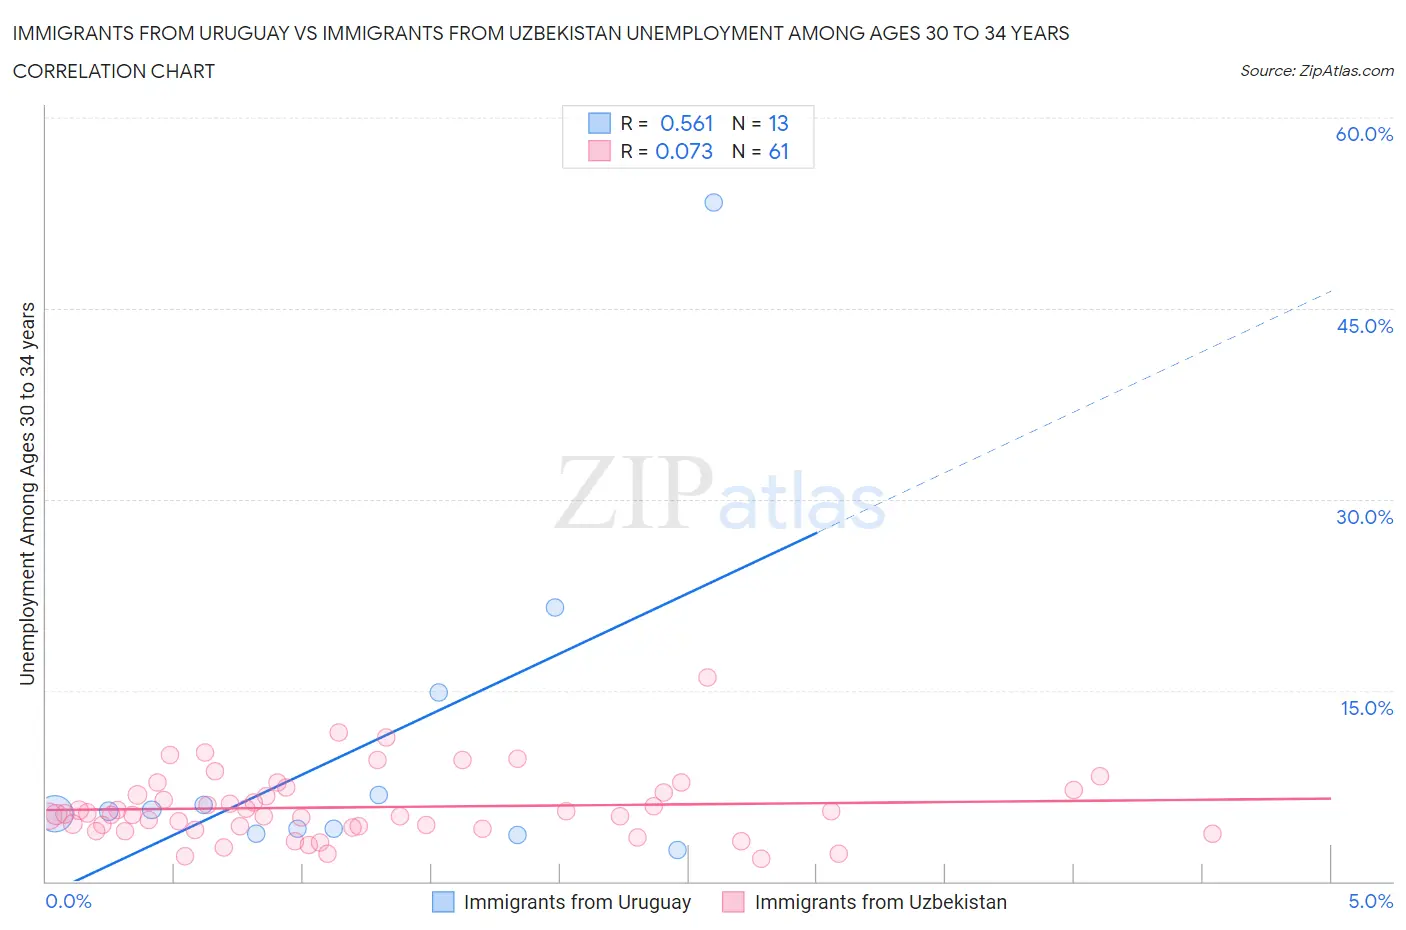
Immigrants from Uruguay vs Immigrants from Uzbekistan Unemployment Among Ages 30 to 34 years Correlation Chart
The statistical analysis conducted on geographies consisting of 130,935,949 people shows a substantial positive correlation between the proportion of Immigrants from Uruguay and unemployment rate among population between the ages 30 and 34 in the United States with a correlation coefficient (R) of 0.561 and weighted average of 5.3%. Similarly, the statistical analysis conducted on geographies consisting of 116,449,224 people shows a slight positive correlation between the proportion of Immigrants from Uzbekistan and unemployment rate among population between the ages 30 and 34 in the United States with a correlation coefficient (R) of 0.073 and weighted average of 5.9%, a difference of 9.9%.
Unemployment Among Ages 30 to 34 years Correlation Summary
| Measurement | Immigrants from Uruguay | Immigrants from Uzbekistan |
| Minimum | 2.5% | 1.8% |
| Maximum | 53.3% | 16.0% |
| Range | 50.8% | 14.2% |
| Mean | 10.5% | 5.8% |
| Median | 5.5% | 5.3% |
| Interquartile 25% (IQ1) | 3.9% | 4.2% |
| Interquartile 75% (IQ3) | 10.8% | 7.1% |
| Interquartile Range (IQR) | 6.9% | 2.9% |
| Standard Deviation (Sample) | 13.9% | 2.6% |
| Standard Deviation (Population) | 13.4% | 2.6% |
Similar Demographics by Unemployment Among Ages 30 to 34 years
Demographics Similar to Immigrants from Uruguay by Unemployment Among Ages 30 to 34 years
In terms of unemployment among ages 30 to 34 years, the demographic groups most similar to Immigrants from Uruguay are Taiwanese (5.3%, a difference of 0.020%), Polish (5.3%, a difference of 0.060%), Immigrants from Sri Lanka (5.3%, a difference of 0.10%), Greek (5.3%, a difference of 0.12%), and German (5.3%, a difference of 0.16%).
| Demographics | Rating | Rank | Unemployment Among Ages 30 to 34 years |
| Romanians | 82.3 /100 | #121 | Excellent 5.3% |
| Immigrants | Netherlands | 81.8 /100 | #122 | Excellent 5.3% |
| Immigrants | Italy | 81.1 /100 | #123 | Excellent 5.3% |
| Immigrants | Brazil | 80.8 /100 | #124 | Excellent 5.3% |
| Greeks | 80.4 /100 | #125 | Excellent 5.3% |
| Immigrants | Sri Lanka | 80.2 /100 | #126 | Excellent 5.3% |
| Taiwanese | 79.4 /100 | #127 | Good 5.3% |
| Immigrants | Uruguay | 79.3 /100 | #128 | Good 5.3% |
| Poles | 78.8 /100 | #129 | Good 5.3% |
| Germans | 77.8 /100 | #130 | Good 5.3% |
| Immigrants | Eastern Europe | 77.4 /100 | #131 | Good 5.3% |
| Carpatho Rusyns | 77.3 /100 | #132 | Good 5.3% |
| Immigrants | Northern Europe | 77.3 /100 | #133 | Good 5.3% |
| Bangladeshis | 76.6 /100 | #134 | Good 5.3% |
| Palestinians | 75.1 /100 | #135 | Good 5.4% |
Demographics Similar to Immigrants from Uzbekistan by Unemployment Among Ages 30 to 34 years
In terms of unemployment among ages 30 to 34 years, the demographic groups most similar to Immigrants from Uzbekistan are Immigrants from Bahamas (5.8%, a difference of 0.31%), Hawaiian (5.9%, a difference of 0.32%), Spanish (5.8%, a difference of 0.39%), Japanese (5.9%, a difference of 0.45%), and Iroquois (5.9%, a difference of 0.59%).
| Demographics | Rating | Rank | Unemployment Among Ages 30 to 34 years |
| Spaniards | 3.2 /100 | #222 | Tragic 5.8% |
| Bermudans | 2.7 /100 | #223 | Tragic 5.8% |
| Slovaks | 2.5 /100 | #224 | Tragic 5.8% |
| Samoans | 2.5 /100 | #225 | Tragic 5.8% |
| Liberians | 2.3 /100 | #226 | Tragic 5.8% |
| Spanish | 1.8 /100 | #227 | Tragic 5.8% |
| Immigrants | Bahamas | 1.8 /100 | #228 | Tragic 5.8% |
| Immigrants | Uzbekistan | 1.5 /100 | #229 | Tragic 5.9% |
| Hawaiians | 1.2 /100 | #230 | Tragic 5.9% |
| Japanese | 1.1 /100 | #231 | Tragic 5.9% |
| Iroquois | 1.0 /100 | #232 | Tragic 5.9% |
| Nepalese | 0.8 /100 | #233 | Tragic 5.9% |
| Portuguese | 0.8 /100 | #234 | Tragic 5.9% |
| Yaqui | 0.7 /100 | #235 | Tragic 5.9% |
| Native Hawaiians | 0.7 /100 | #236 | Tragic 5.9% |