Fijian vs Immigrants from Greece College, 1 year or more
COMPARE
Fijian
Immigrants from Greece
College, 1 year or more
College, 1 year or more Comparison
Fijians
Immigrants from Greece
51.3%
COLLEGE, 1 YEAR OR MORE
0.0/ 100
METRIC RATING
314th/ 347
METRIC RANK
63.3%
COLLEGE, 1 YEAR OR MORE
99.3/ 100
METRIC RATING
68th/ 347
METRIC RANK
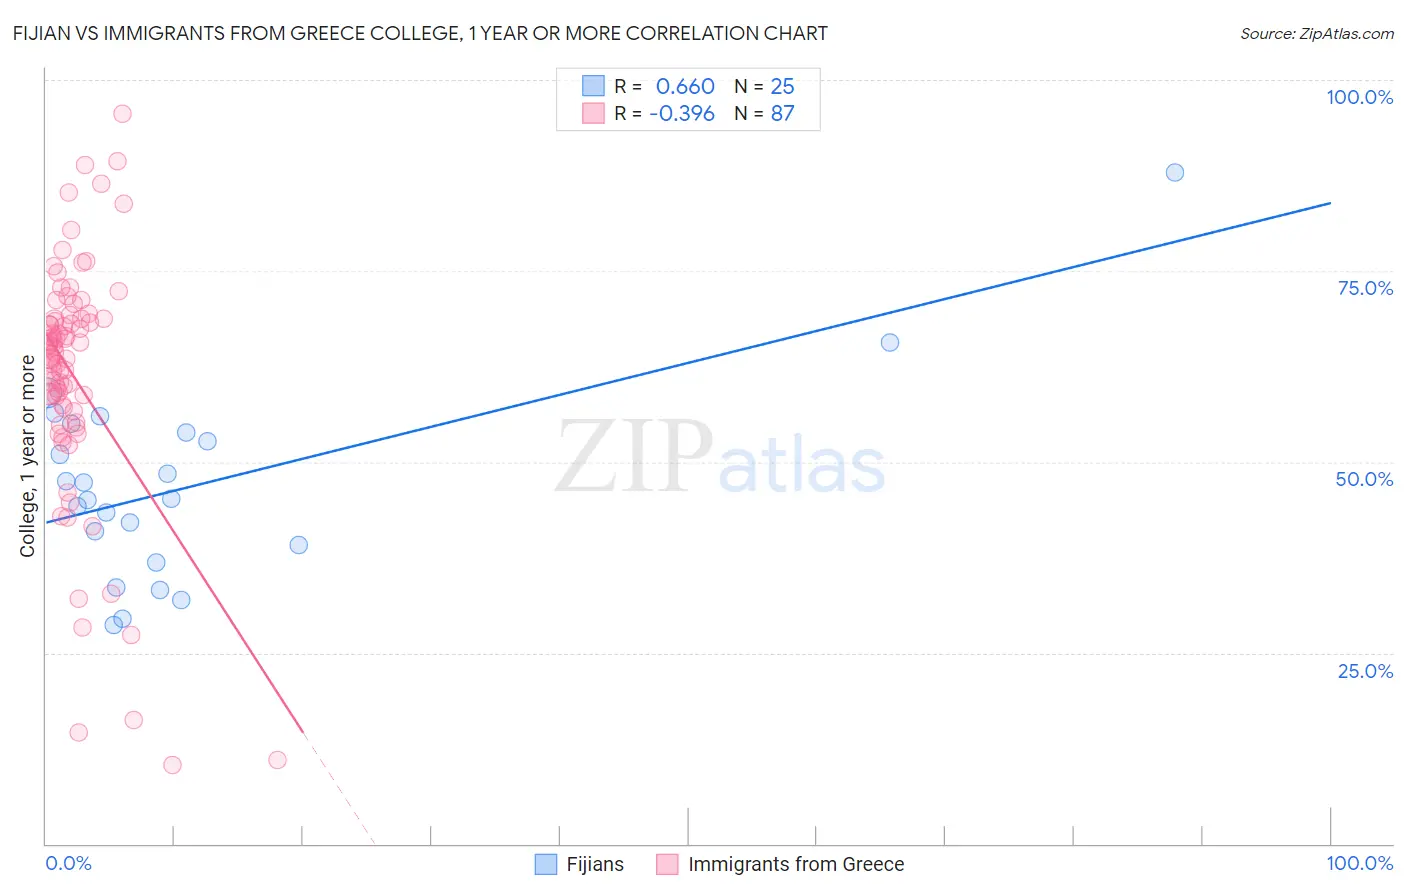
Fijian vs Immigrants from Greece College, 1 year or more Correlation Chart
The statistical analysis conducted on geographies consisting of 55,948,842 people shows a significant positive correlation between the proportion of Fijians and percentage of population with at least college, 1 year or more education in the United States with a correlation coefficient (R) of 0.660 and weighted average of 51.3%. Similarly, the statistical analysis conducted on geographies consisting of 216,878,684 people shows a mild negative correlation between the proportion of Immigrants from Greece and percentage of population with at least college, 1 year or more education in the United States with a correlation coefficient (R) of -0.396 and weighted average of 63.3%, a difference of 23.3%.
College, 1 year or more Correlation Summary
| Measurement | Fijian | Immigrants from Greece |
| Minimum | 28.6% | 10.3% |
| Maximum | 87.8% | 95.6% |
| Range | 59.3% | 85.3% |
| Mean | 47.0% | 61.2% |
| Median | 45.2% | 64.4% |
| Interquartile 25% (IQ1) | 38.0% | 56.6% |
| Interquartile 75% (IQ3) | 54.4% | 68.8% |
| Interquartile Range (IQR) | 16.4% | 12.2% |
| Standard Deviation (Sample) | 12.9% | 16.4% |
| Standard Deviation (Population) | 12.6% | 16.3% |
Similar Demographics by College, 1 year or more
Demographics Similar to Fijians by College, 1 year or more
In terms of college, 1 year or more, the demographic groups most similar to Fijians are Immigrants from Caribbean (51.4%, a difference of 0.22%), Guatemalan (51.2%, a difference of 0.23%), Cajun (51.2%, a difference of 0.30%), Pueblo (51.5%, a difference of 0.35%), and Immigrants from Haiti (51.5%, a difference of 0.39%).
| Demographics | Rating | Rank | College, 1 year or more |
| Immigrants | Portugal | 0.0 /100 | #307 | Tragic 51.9% |
| Salvadorans | 0.0 /100 | #308 | Tragic 51.8% |
| Apache | 0.0 /100 | #309 | Tragic 51.8% |
| Hondurans | 0.0 /100 | #310 | Tragic 51.6% |
| Immigrants | Haiti | 0.0 /100 | #311 | Tragic 51.5% |
| Pueblo | 0.0 /100 | #312 | Tragic 51.5% |
| Immigrants | Caribbean | 0.0 /100 | #313 | Tragic 51.4% |
| Fijians | 0.0 /100 | #314 | Tragic 51.3% |
| Guatemalans | 0.0 /100 | #315 | Tragic 51.2% |
| Cajuns | 0.0 /100 | #316 | Tragic 51.2% |
| Hispanics or Latinos | 0.0 /100 | #317 | Tragic 51.1% |
| Immigrants | Honduras | 0.0 /100 | #318 | Tragic 51.0% |
| Immigrants | El Salvador | 0.0 /100 | #319 | Tragic 51.0% |
| Kiowa | 0.0 /100 | #320 | Tragic 51.0% |
| Hopi | 0.0 /100 | #321 | Tragic 50.9% |
Demographics Similar to Immigrants from Greece by College, 1 year or more
In terms of college, 1 year or more, the demographic groups most similar to Immigrants from Greece are Immigrants from Zimbabwe (63.3%, a difference of 0.0%), Immigrants from Romania (63.3%, a difference of 0.020%), Immigrants from Europe (63.3%, a difference of 0.030%), Argentinean (63.2%, a difference of 0.10%), and Maltese (63.4%, a difference of 0.14%).
| Demographics | Rating | Rank | College, 1 year or more |
| Bolivians | 99.5 /100 | #61 | Exceptional 63.5% |
| Immigrants | Indonesia | 99.5 /100 | #62 | Exceptional 63.5% |
| Immigrants | Scotland | 99.4 /100 | #63 | Exceptional 63.4% |
| Immigrants | Spain | 99.4 /100 | #64 | Exceptional 63.4% |
| Maltese | 99.3 /100 | #65 | Exceptional 63.4% |
| Immigrants | Europe | 99.3 /100 | #66 | Exceptional 63.3% |
| Immigrants | Romania | 99.3 /100 | #67 | Exceptional 63.3% |
| Immigrants | Greece | 99.3 /100 | #68 | Exceptional 63.3% |
| Immigrants | Zimbabwe | 99.3 /100 | #69 | Exceptional 63.3% |
| Argentineans | 99.2 /100 | #70 | Exceptional 63.2% |
| Immigrants | Canada | 99.1 /100 | #71 | Exceptional 63.1% |
| Egyptians | 99.0 /100 | #72 | Exceptional 63.1% |
| Immigrants | Moldova | 99.0 /100 | #73 | Exceptional 63.0% |
| Immigrants | North America | 99.0 /100 | #74 | Exceptional 63.0% |
| Armenians | 98.9 /100 | #75 | Exceptional 63.0% |