Immigrants from Japan vs Osage Doctorate Degree
COMPARE
Immigrants from Japan
Osage
Doctorate Degree
Doctorate Degree Comparison
Immigrants from Japan
Osage
2.8%
DOCTORATE DEGREE
100.0/ 100
METRIC RATING
19th/ 347
METRIC RANK
1.7%
DOCTORATE DEGREE
6.5/ 100
METRIC RATING
226th/ 347
METRIC RANK
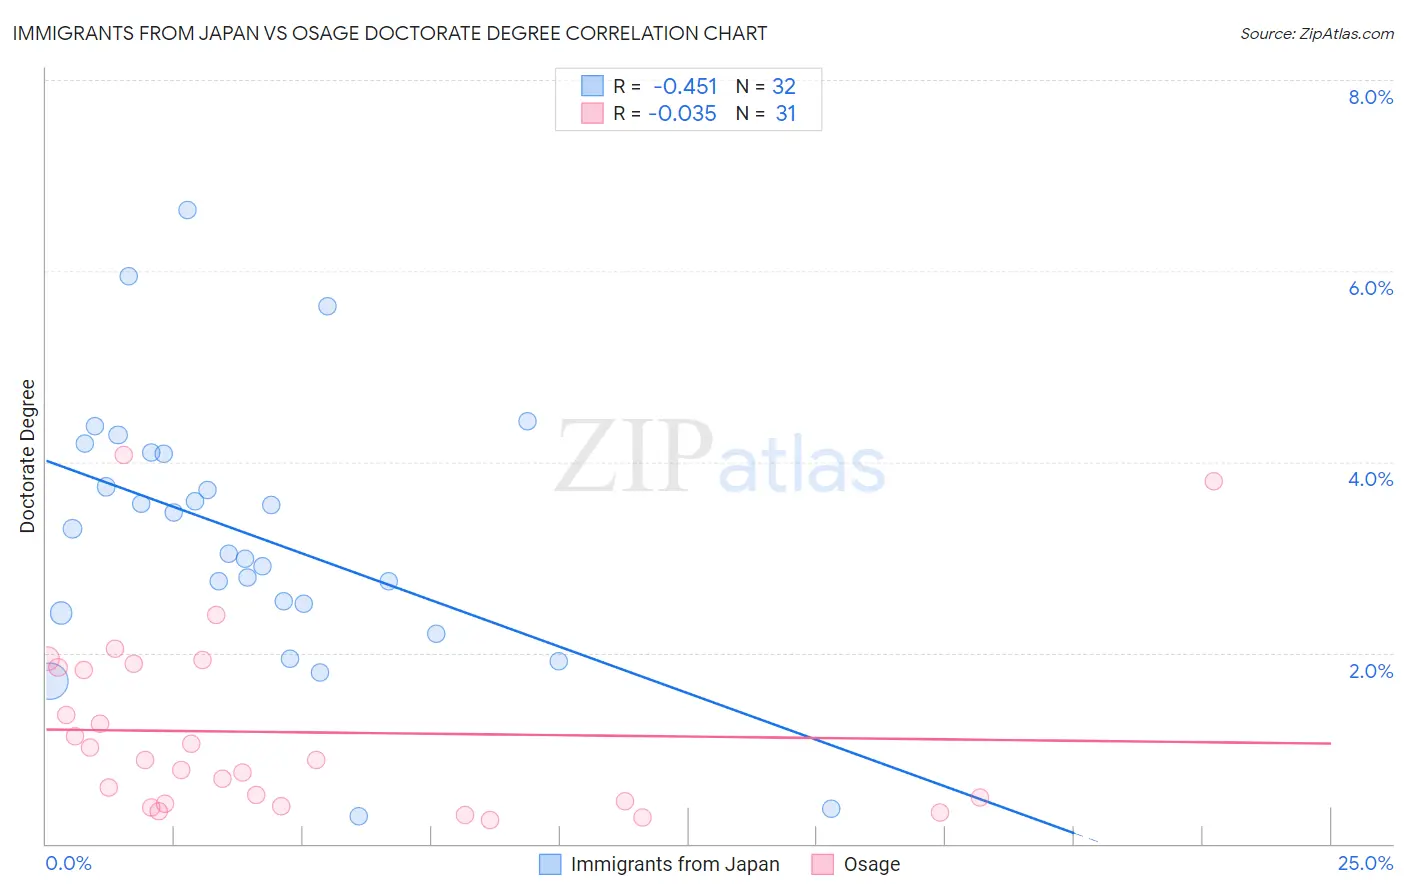
Immigrants from Japan vs Osage Doctorate Degree Correlation Chart
The statistical analysis conducted on geographies consisting of 338,241,347 people shows a moderate negative correlation between the proportion of Immigrants from Japan and percentage of population with at least doctorate degree education in the United States with a correlation coefficient (R) of -0.451 and weighted average of 2.8%. Similarly, the statistical analysis conducted on geographies consisting of 91,292,964 people shows no correlation between the proportion of Osage and percentage of population with at least doctorate degree education in the United States with a correlation coefficient (R) of -0.035 and weighted average of 1.7%, a difference of 67.8%.
Doctorate Degree Correlation Summary
| Measurement | Immigrants from Japan | Osage |
| Minimum | 0.28% | 0.25% |
| Maximum | 6.6% | 4.1% |
| Range | 6.4% | 3.8% |
| Mean | 3.2% | 1.2% |
| Median | 3.2% | 0.87% |
| Interquartile 25% (IQ1) | 2.5% | 0.42% |
| Interquartile 75% (IQ3) | 4.1% | 1.9% |
| Interquartile Range (IQR) | 1.6% | 1.4% |
| Standard Deviation (Sample) | 1.4% | 0.97% |
| Standard Deviation (Population) | 1.4% | 0.96% |
Similar Demographics by Doctorate Degree
Demographics Similar to Immigrants from Japan by Doctorate Degree
In terms of doctorate degree, the demographic groups most similar to Immigrants from Japan are Immigrants from Hong Kong (2.8%, a difference of 0.35%), Immigrants from Sri Lanka (2.8%, a difference of 0.37%), Immigrants from Australia (2.8%, a difference of 0.62%), Thai (2.8%, a difference of 0.70%), and Mongolian (2.8%, a difference of 0.91%).
| Demographics | Rating | Rank | Doctorate Degree |
| Immigrants | Belgium | 100.0 /100 | #12 | Exceptional 2.9% |
| Immigrants | Sweden | 100.0 /100 | #13 | Exceptional 2.9% |
| Immigrants | France | 100.0 /100 | #14 | Exceptional 2.9% |
| Immigrants | India | 100.0 /100 | #15 | Exceptional 2.8% |
| Eastern Europeans | 100.0 /100 | #16 | Exceptional 2.8% |
| Immigrants | Australia | 100.0 /100 | #17 | Exceptional 2.8% |
| Immigrants | Sri Lanka | 100.0 /100 | #18 | Exceptional 2.8% |
| Immigrants | Japan | 100.0 /100 | #19 | Exceptional 2.8% |
| Immigrants | Hong Kong | 100.0 /100 | #20 | Exceptional 2.8% |
| Thais | 100.0 /100 | #21 | Exceptional 2.8% |
| Mongolians | 100.0 /100 | #22 | Exceptional 2.8% |
| Immigrants | Denmark | 100.0 /100 | #23 | Exceptional 2.8% |
| Israelis | 100.0 /100 | #24 | Exceptional 2.7% |
| Immigrants | Saudi Arabia | 100.0 /100 | #25 | Exceptional 2.7% |
| Turks | 100.0 /100 | #26 | Exceptional 2.7% |
Demographics Similar to Osage by Doctorate Degree
In terms of doctorate degree, the demographic groups most similar to Osage are Immigrants from Colombia (1.7%, a difference of 0.12%), Panamanian (1.7%, a difference of 0.14%), Assyrian/Chaldean/Syriac (1.7%, a difference of 0.42%), Immigrants from Poland (1.7%, a difference of 0.61%), and Immigrants from Bosnia and Herzegovina (1.7%, a difference of 0.83%).
| Demographics | Rating | Rank | Doctorate Degree |
| Immigrants | Iraq | 10.7 /100 | #219 | Poor 1.7% |
| Immigrants | Uruguay | 9.2 /100 | #220 | Tragic 1.7% |
| Immigrants | Nonimmigrants | 8.8 /100 | #221 | Tragic 1.7% |
| Immigrants | Venezuela | 8.7 /100 | #222 | Tragic 1.7% |
| Immigrants | Bosnia and Herzegovina | 7.8 /100 | #223 | Tragic 1.7% |
| Immigrants | Poland | 7.4 /100 | #224 | Tragic 1.7% |
| Immigrants | Colombia | 6.7 /100 | #225 | Tragic 1.7% |
| Osage | 6.5 /100 | #226 | Tragic 1.7% |
| Panamanians | 6.3 /100 | #227 | Tragic 1.7% |
| Assyrians/Chaldeans/Syriacs | 5.9 /100 | #228 | Tragic 1.7% |
| Colville | 4.7 /100 | #229 | Tragic 1.6% |
| Immigrants | Philippines | 4.3 /100 | #230 | Tragic 1.6% |
| Immigrants | North Macedonia | 3.9 /100 | #231 | Tragic 1.6% |
| Guamanians/Chamorros | 3.3 /100 | #232 | Tragic 1.6% |
| Barbadians | 3.3 /100 | #233 | Tragic 1.6% |