Immigrants from Spain vs German Russian 1st Grade
COMPARE
Immigrants from Spain
German Russian
1st Grade
1st Grade Comparison
Immigrants from Spain
German Russians
97.9%
1ST GRADE
54.9/ 100
METRIC RATING
170th/ 347
METRIC RANK
98.2%
1ST GRADE
97.1/ 100
METRIC RATING
109th/ 347
METRIC RANK
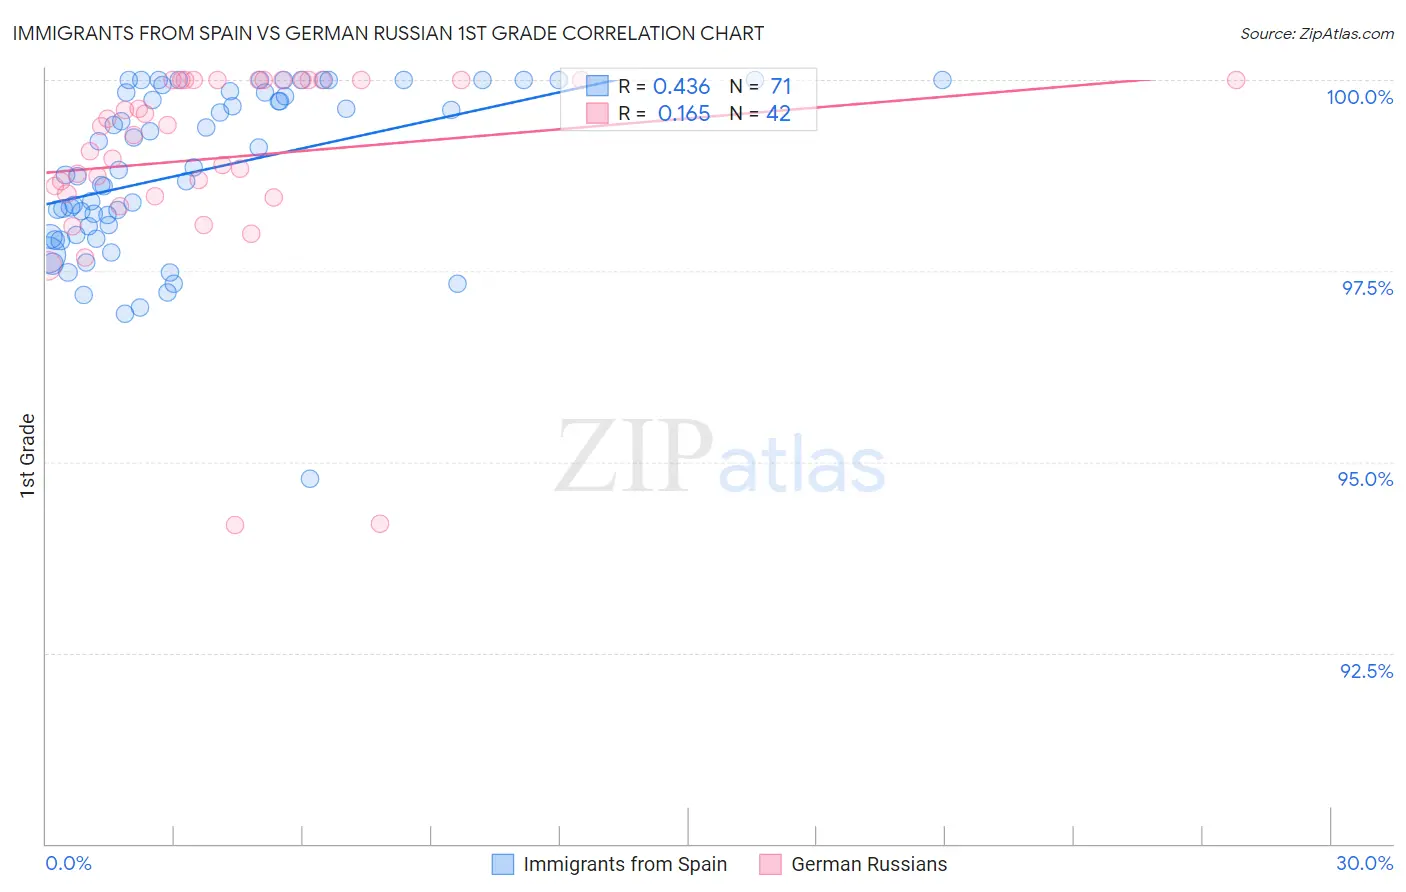
Immigrants from Spain vs German Russian 1st Grade Correlation Chart
The statistical analysis conducted on geographies consisting of 239,682,160 people shows a moderate positive correlation between the proportion of Immigrants from Spain and percentage of population with at least 1st grade education in the United States with a correlation coefficient (R) of 0.436 and weighted average of 97.9%. Similarly, the statistical analysis conducted on geographies consisting of 96,461,520 people shows a poor positive correlation between the proportion of German Russians and percentage of population with at least 1st grade education in the United States with a correlation coefficient (R) of 0.165 and weighted average of 98.2%, a difference of 0.26%.
1st Grade Correlation Summary
| Measurement | Immigrants from Spain | German Russian |
| Minimum | 94.8% | 94.2% |
| Maximum | 100.0% | 100.0% |
| Range | 5.2% | 5.8% |
| Mean | 98.8% | 99.0% |
| Median | 98.8% | 99.3% |
| Interquartile 25% (IQ1) | 98.0% | 98.5% |
| Interquartile 75% (IQ3) | 99.8% | 100.0% |
| Interquartile Range (IQR) | 1.9% | 1.5% |
| Standard Deviation (Sample) | 1.1% | 1.3% |
| Standard Deviation (Population) | 1.1% | 1.3% |
Similar Demographics by 1st Grade
Demographics Similar to Immigrants from Spain by 1st Grade
In terms of 1st grade, the demographic groups most similar to Immigrants from Spain are Bermudan (97.9%, a difference of 0.0%), Chilean (97.9%, a difference of 0.0%), Immigrants from Micronesia (97.9%, a difference of 0.0%), Immigrants from Jordan (97.9%, a difference of 0.0%), and Spanish American (97.9%, a difference of 0.010%).
| Demographics | Rating | Rank | 1st Grade |
| Spanish Americans | 57.7 /100 | #163 | Average 97.9% |
| Brazilians | 57.6 /100 | #164 | Average 97.9% |
| Ugandans | 56.9 /100 | #165 | Average 97.9% |
| Navajo | 56.6 /100 | #166 | Average 97.9% |
| Bermudans | 56.3 /100 | #167 | Average 97.9% |
| Chileans | 55.6 /100 | #168 | Average 97.9% |
| Immigrants | Micronesia | 55.3 /100 | #169 | Average 97.9% |
| Immigrants | Spain | 54.9 /100 | #170 | Average 97.9% |
| Immigrants | Jordan | 53.9 /100 | #171 | Average 97.9% |
| Immigrants | Korea | 53.0 /100 | #172 | Average 97.9% |
| Kenyans | 51.2 /100 | #173 | Average 97.9% |
| Natives/Alaskans | 50.0 /100 | #174 | Average 97.9% |
| Immigrants | Sri Lanka | 49.7 /100 | #175 | Average 97.9% |
| Albanians | 49.6 /100 | #176 | Average 97.9% |
| Immigrants | Brazil | 49.1 /100 | #177 | Average 97.9% |
Demographics Similar to German Russians by 1st Grade
In terms of 1st grade, the demographic groups most similar to German Russians are Immigrants from Switzerland (98.2%, a difference of 0.0%), Bhutanese (98.2%, a difference of 0.0%), Pima (98.2%, a difference of 0.010%), Basque (98.2%, a difference of 0.010%), and Turkish (98.2%, a difference of 0.010%).
| Demographics | Rating | Rank | 1st Grade |
| Cree | 97.8 /100 | #102 | Exceptional 98.2% |
| Immigrants | Ireland | 97.7 /100 | #103 | Exceptional 98.2% |
| Pima | 97.5 /100 | #104 | Exceptional 98.2% |
| Basques | 97.4 /100 | #105 | Exceptional 98.2% |
| Turks | 97.4 /100 | #106 | Exceptional 98.2% |
| Immigrants | Switzerland | 97.3 /100 | #107 | Exceptional 98.2% |
| Bhutanese | 97.3 /100 | #108 | Exceptional 98.2% |
| German Russians | 97.1 /100 | #109 | Exceptional 98.2% |
| Immigrants | Singapore | 96.7 /100 | #110 | Exceptional 98.2% |
| Immigrants | Czechoslovakia | 96.6 /100 | #111 | Exceptional 98.2% |
| Immigrants | Norway | 96.6 /100 | #112 | Exceptional 98.2% |
| Immigrants | Latvia | 96.4 /100 | #113 | Exceptional 98.2% |
| Ute | 96.2 /100 | #114 | Exceptional 98.2% |
| Iranians | 96.0 /100 | #115 | Exceptional 98.2% |
| Spanish | 95.9 /100 | #116 | Exceptional 98.2% |