Immigrants from Thailand vs Argentinean 7th Grade
COMPARE
Immigrants from Thailand
Argentinean
7th Grade
7th Grade Comparison
Immigrants from Thailand
Argentineans
95.1%
7TH GRADE
0.2/ 100
METRIC RATING
276th/ 347
METRIC RANK
95.9%
7TH GRADE
23.2/ 100
METRIC RATING
200th/ 347
METRIC RANK
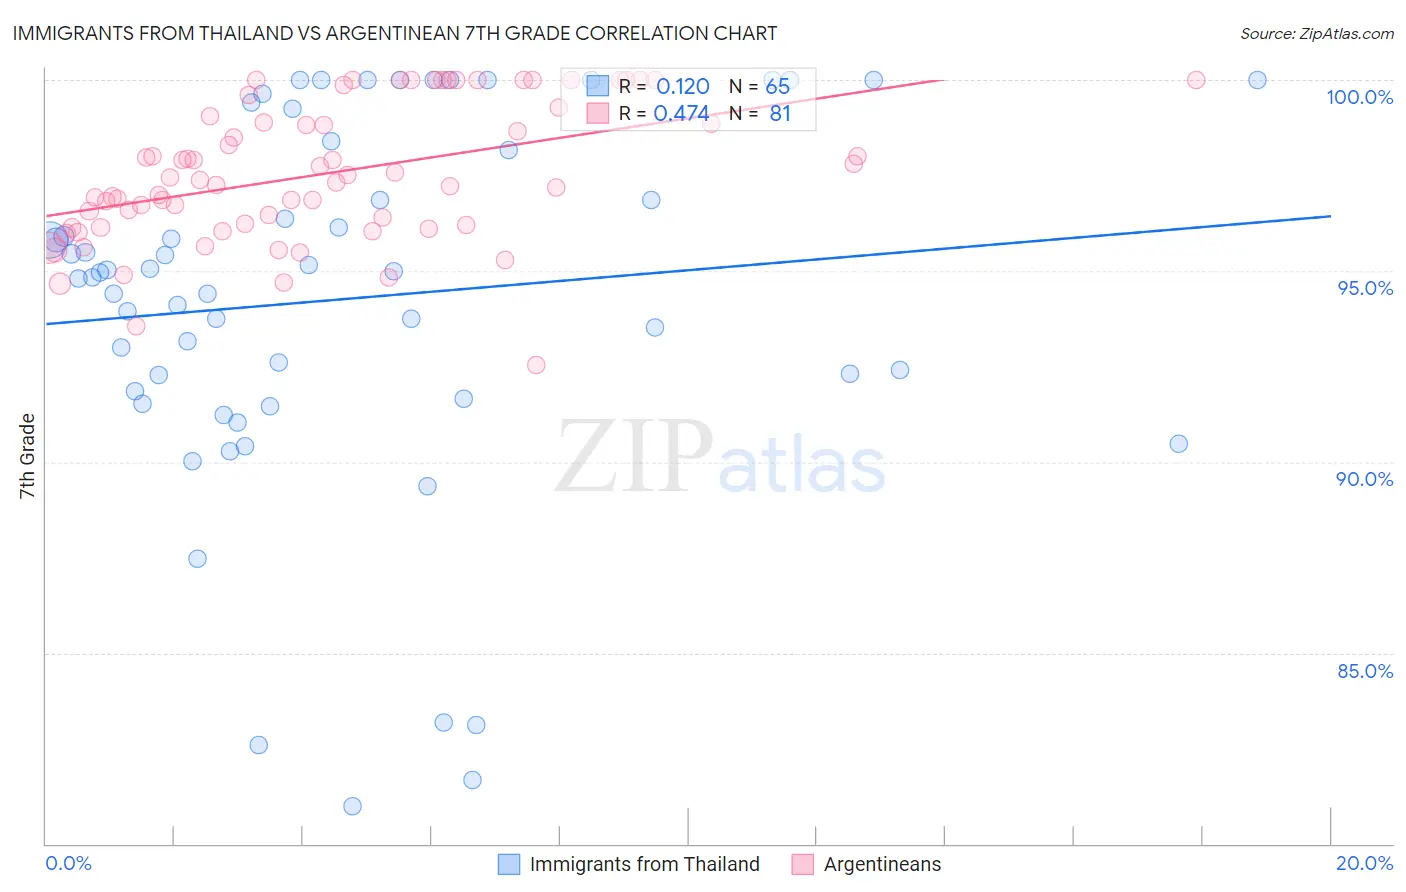
Immigrants from Thailand vs Argentinean 7th Grade Correlation Chart
The statistical analysis conducted on geographies consisting of 317,023,903 people shows a poor positive correlation between the proportion of Immigrants from Thailand and percentage of population with at least 7th grade education in the United States with a correlation coefficient (R) of 0.120 and weighted average of 95.1%. Similarly, the statistical analysis conducted on geographies consisting of 297,141,515 people shows a moderate positive correlation between the proportion of Argentineans and percentage of population with at least 7th grade education in the United States with a correlation coefficient (R) of 0.474 and weighted average of 95.9%, a difference of 0.79%.
7th Grade Correlation Summary
| Measurement | Immigrants from Thailand | Argentinean |
| Minimum | 81.0% | 92.5% |
| Maximum | 100.0% | 100.0% |
| Range | 19.0% | 7.5% |
| Mean | 94.3% | 97.6% |
| Median | 94.9% | 97.4% |
| Interquartile 25% (IQ1) | 91.8% | 96.2% |
| Interquartile 75% (IQ3) | 98.3% | 99.2% |
| Interquartile Range (IQR) | 6.5% | 3.0% |
| Standard Deviation (Sample) | 4.8% | 1.8% |
| Standard Deviation (Population) | 4.7% | 1.8% |
Similar Demographics by 7th Grade
Demographics Similar to Immigrants from Thailand by 7th Grade
In terms of 7th grade, the demographic groups most similar to Immigrants from Thailand are Immigrants from Colombia (95.1%, a difference of 0.020%), Immigrants from Afghanistan (95.1%, a difference of 0.020%), Immigrants from South America (95.1%, a difference of 0.030%), Peruvian (95.1%, a difference of 0.030%), and Immigrants from Uzbekistan (95.1%, a difference of 0.030%).
| Demographics | Rating | Rank | 7th Grade |
| Trinidadians and Tobagonians | 0.3 /100 | #269 | Tragic 95.2% |
| Houma | 0.2 /100 | #270 | Tragic 95.1% |
| Immigrants | South America | 0.2 /100 | #271 | Tragic 95.1% |
| Peruvians | 0.2 /100 | #272 | Tragic 95.1% |
| Immigrants | Uzbekistan | 0.2 /100 | #273 | Tragic 95.1% |
| Immigrants | Western Africa | 0.2 /100 | #274 | Tragic 95.1% |
| Immigrants | Colombia | 0.2 /100 | #275 | Tragic 95.1% |
| Immigrants | Thailand | 0.2 /100 | #276 | Tragic 95.1% |
| Immigrants | Afghanistan | 0.2 /100 | #277 | Tragic 95.1% |
| Immigrants | Trinidad and Tobago | 0.1 /100 | #278 | Tragic 95.1% |
| Barbadians | 0.1 /100 | #279 | Tragic 95.1% |
| Immigrants | St. Vincent and the Grenadines | 0.1 /100 | #280 | Tragic 95.0% |
| Tohono O'odham | 0.1 /100 | #281 | Tragic 95.0% |
| Immigrants | Bolivia | 0.1 /100 | #282 | Tragic 95.0% |
| Immigrants | Barbados | 0.1 /100 | #283 | Tragic 95.0% |
Demographics Similar to Argentineans by 7th Grade
In terms of 7th grade, the demographic groups most similar to Argentineans are Guamanian/Chamorro (95.9%, a difference of 0.0%), Paraguayan (95.9%, a difference of 0.010%), Immigrants from Argentina (95.9%, a difference of 0.010%), Immigrants from Northern Africa (95.8%, a difference of 0.020%), and Comanche (95.8%, a difference of 0.020%).
| Demographics | Rating | Rank | 7th Grade |
| Immigrants | Bahamas | 30.8 /100 | #193 | Fair 95.9% |
| Immigrants | Nepal | 30.0 /100 | #194 | Fair 95.9% |
| Sudanese | 28.1 /100 | #195 | Fair 95.9% |
| Apache | 27.6 /100 | #196 | Fair 95.9% |
| Immigrants | Zaire | 26.7 /100 | #197 | Fair 95.9% |
| Paraguayans | 24.8 /100 | #198 | Fair 95.9% |
| Guamanians/Chamorros | 23.5 /100 | #199 | Fair 95.9% |
| Argentineans | 23.2 /100 | #200 | Fair 95.9% |
| Immigrants | Argentina | 21.9 /100 | #201 | Fair 95.9% |
| Immigrants | Northern Africa | 21.4 /100 | #202 | Fair 95.8% |
| Comanche | 21.1 /100 | #203 | Fair 95.8% |
| Assyrians/Chaldeans/Syriacs | 20.5 /100 | #204 | Fair 95.8% |
| Moroccans | 18.9 /100 | #205 | Poor 95.8% |
| Africans | 17.6 /100 | #206 | Poor 95.8% |
| Navajo | 17.0 /100 | #207 | Poor 95.8% |