Immigrants from Serbia vs Indonesian Master's Degree
COMPARE
Immigrants from Serbia
Indonesian
Master's Degree
Master's Degree Comparison
Immigrants from Serbia
Indonesians
18.5%
MASTER'S DEGREE
99.9/ 100
METRIC RATING
55th/ 347
METRIC RANK
12.6%
MASTER'S DEGREE
0.8/ 100
METRIC RATING
254th/ 347
METRIC RANK
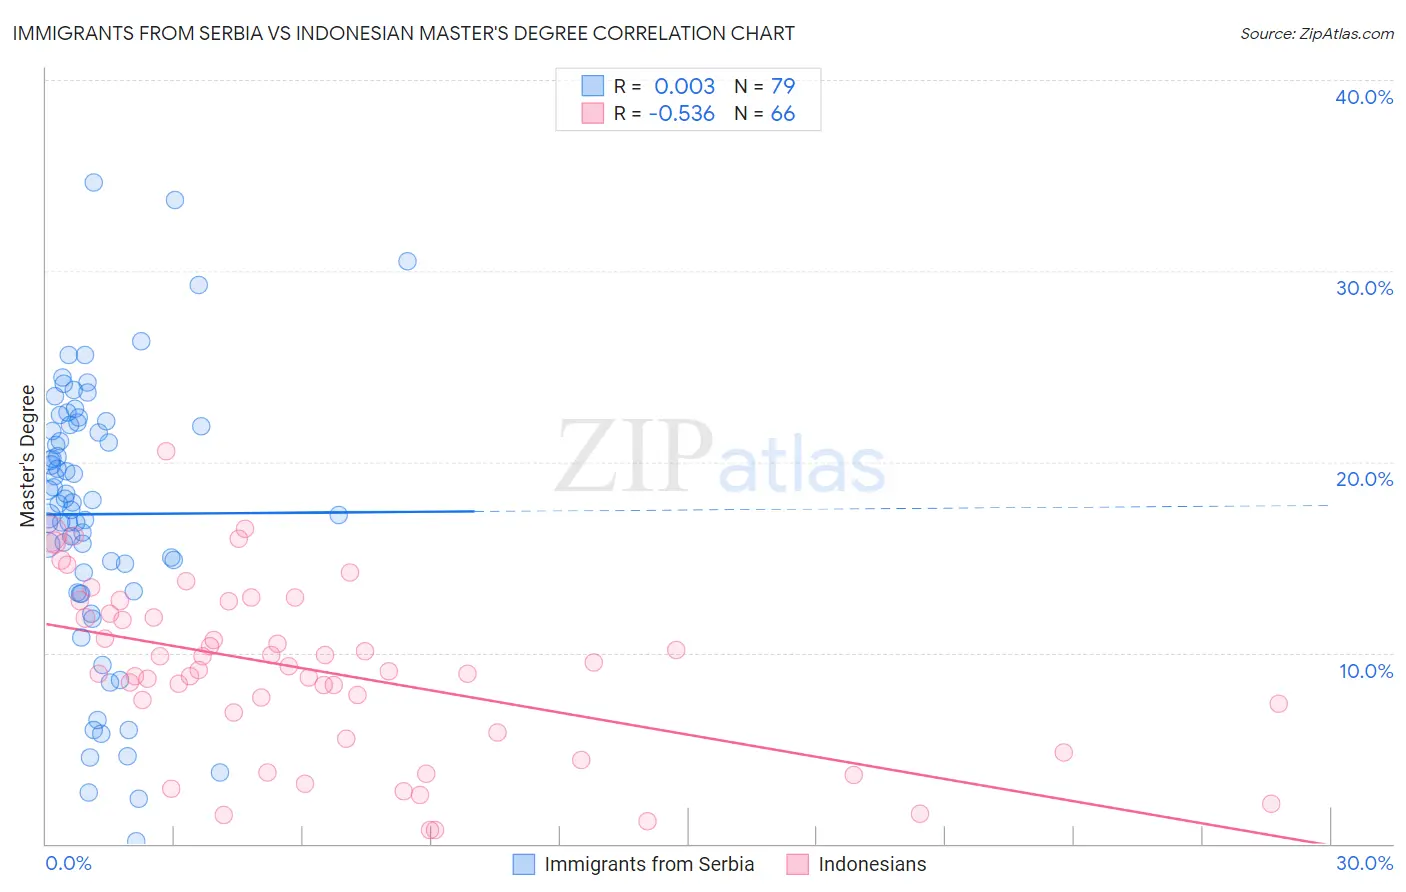
Immigrants from Serbia vs Indonesian Master's Degree Correlation Chart
The statistical analysis conducted on geographies consisting of 131,731,006 people shows no correlation between the proportion of Immigrants from Serbia and percentage of population with at least master's degree education in the United States with a correlation coefficient (R) of 0.003 and weighted average of 18.5%. Similarly, the statistical analysis conducted on geographies consisting of 162,683,537 people shows a substantial negative correlation between the proportion of Indonesians and percentage of population with at least master's degree education in the United States with a correlation coefficient (R) of -0.536 and weighted average of 12.6%, a difference of 46.2%.
Master's Degree Correlation Summary
| Measurement | Immigrants from Serbia | Indonesian |
| Minimum | 0.15% | 0.73% |
| Maximum | 34.6% | 20.6% |
| Range | 34.5% | 19.8% |
| Mean | 17.3% | 9.0% |
| Median | 17.9% | 9.1% |
| Interquartile 25% (IQ1) | 13.2% | 5.8% |
| Interquartile 75% (IQ3) | 22.0% | 12.0% |
| Interquartile Range (IQR) | 8.7% | 6.2% |
| Standard Deviation (Sample) | 7.1% | 4.5% |
| Standard Deviation (Population) | 7.0% | 4.5% |
Similar Demographics by Master's Degree
Demographics Similar to Immigrants from Serbia by Master's Degree
In terms of master's degree, the demographic groups most similar to Immigrants from Serbia are Immigrants from Lithuania (18.5%, a difference of 0.030%), Asian (18.4%, a difference of 0.22%), Immigrants from Czechoslovakia (18.5%, a difference of 0.34%), Immigrants from Asia (18.4%, a difference of 0.36%), and Immigrants from Kuwait (18.6%, a difference of 0.42%).
| Demographics | Rating | Rank | Master's Degree |
| Paraguayans | 100.0 /100 | #48 | Exceptional 18.8% |
| Estonians | 100.0 /100 | #49 | Exceptional 18.8% |
| Bulgarians | 100.0 /100 | #50 | Exceptional 18.8% |
| Immigrants | South Africa | 100.0 /100 | #51 | Exceptional 18.8% |
| Immigrants | Kuwait | 100.0 /100 | #52 | Exceptional 18.6% |
| Immigrants | Czechoslovakia | 99.9 /100 | #53 | Exceptional 18.5% |
| Immigrants | Lithuania | 99.9 /100 | #54 | Exceptional 18.5% |
| Immigrants | Serbia | 99.9 /100 | #55 | Exceptional 18.5% |
| Asians | 99.9 /100 | #56 | Exceptional 18.4% |
| Immigrants | Asia | 99.9 /100 | #57 | Exceptional 18.4% |
| Australians | 99.9 /100 | #58 | Exceptional 18.4% |
| Immigrants | Bulgaria | 99.9 /100 | #59 | Exceptional 18.3% |
| New Zealanders | 99.9 /100 | #60 | Exceptional 18.3% |
| Immigrants | Europe | 99.9 /100 | #61 | Exceptional 18.2% |
| Argentineans | 99.9 /100 | #62 | Exceptional 18.2% |
Demographics Similar to Indonesians by Master's Degree
In terms of master's degree, the demographic groups most similar to Indonesians are Immigrants from Congo (12.6%, a difference of 0.030%), Immigrants from Dominica (12.6%, a difference of 0.040%), Immigrants from Portugal (12.6%, a difference of 0.10%), Osage (12.6%, a difference of 0.58%), and French American Indian (12.7%, a difference of 0.59%).
| Demographics | Rating | Rank | Master's Degree |
| Iroquois | 1.4 /100 | #247 | Tragic 12.9% |
| Africans | 1.4 /100 | #248 | Tragic 12.9% |
| Cree | 1.3 /100 | #249 | Tragic 12.8% |
| Liberians | 1.3 /100 | #250 | Tragic 12.8% |
| Tlingit-Haida | 1.3 /100 | #251 | Tragic 12.8% |
| French American Indians | 1.0 /100 | #252 | Tragic 12.7% |
| Immigrants | Dominica | 0.8 /100 | #253 | Tragic 12.6% |
| Indonesians | 0.8 /100 | #254 | Tragic 12.6% |
| Immigrants | Congo | 0.8 /100 | #255 | Tragic 12.6% |
| Immigrants | Portugal | 0.8 /100 | #256 | Tragic 12.6% |
| Osage | 0.7 /100 | #257 | Tragic 12.6% |
| Immigrants | Liberia | 0.6 /100 | #258 | Tragic 12.5% |
| Japanese | 0.6 /100 | #259 | Tragic 12.5% |
| Dominicans | 0.6 /100 | #260 | Tragic 12.5% |
| Tongans | 0.6 /100 | #261 | Tragic 12.5% |