Immigrants from Cambodia vs Senegalese 2nd Grade
COMPARE
Immigrants from Cambodia
Senegalese
2nd Grade
2nd Grade Comparison
Immigrants from Cambodia
Senegalese
96.4%
2ND GRADE
0.0/ 100
METRIC RATING
337th/ 347
METRIC RANK
97.6%
2ND GRADE
3.1/ 100
METRIC RATING
230th/ 347
METRIC RANK
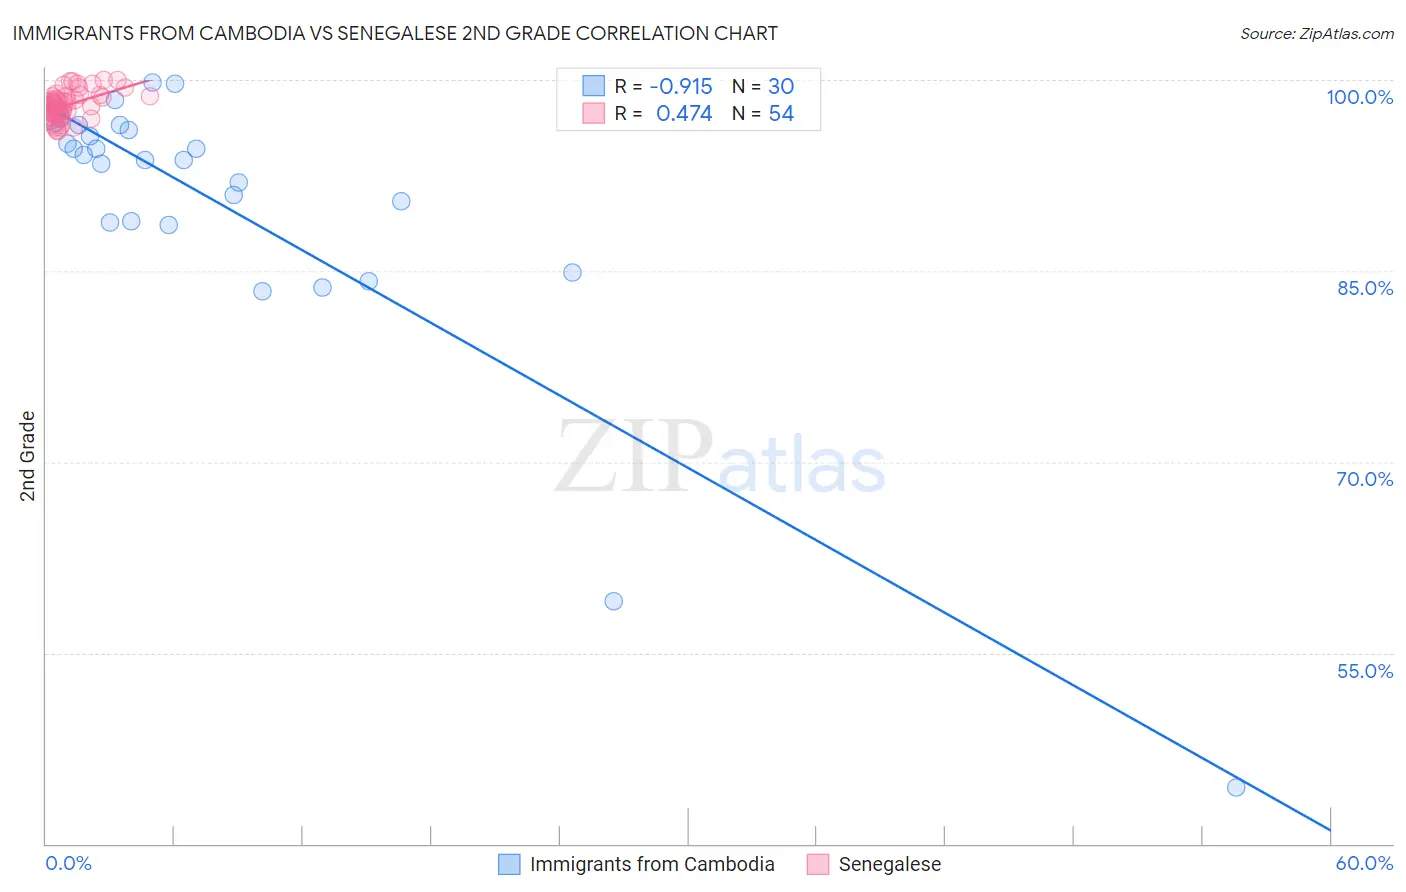
Immigrants from Cambodia vs Senegalese 2nd Grade Correlation Chart
The statistical analysis conducted on geographies consisting of 205,153,442 people shows a near-perfect negative correlation between the proportion of Immigrants from Cambodia and percentage of population with at least 2nd grade education in the United States with a correlation coefficient (R) of -0.915 and weighted average of 96.4%. Similarly, the statistical analysis conducted on geographies consisting of 78,142,569 people shows a moderate positive correlation between the proportion of Senegalese and percentage of population with at least 2nd grade education in the United States with a correlation coefficient (R) of 0.474 and weighted average of 97.6%, a difference of 1.3%.
2nd Grade Correlation Summary
| Measurement | Immigrants from Cambodia | Senegalese |
| Minimum | 44.4% | 96.0% |
| Maximum | 99.8% | 100.0% |
| Range | 55.4% | 4.0% |
| Mean | 90.2% | 98.0% |
| Median | 93.9% | 98.0% |
| Interquartile 25% (IQ1) | 88.8% | 97.4% |
| Interquartile 75% (IQ3) | 96.5% | 98.7% |
| Interquartile Range (IQR) | 7.7% | 1.3% |
| Standard Deviation (Sample) | 11.6% | 1.1% |
| Standard Deviation (Population) | 11.4% | 1.1% |
Similar Demographics by 2nd Grade
Demographics Similar to Immigrants from Cambodia by 2nd Grade
In terms of 2nd grade, the demographic groups most similar to Immigrants from Cambodia are Immigrants from Fiji (96.4%, a difference of 0.010%), Yakama (96.4%, a difference of 0.020%), Immigrants from Cabo Verde (96.3%, a difference of 0.020%), Central American (96.4%, a difference of 0.030%), and Immigrants from Dominican Republic (96.4%, a difference of 0.050%).
| Demographics | Rating | Rank | 2nd Grade |
| Immigrants | Latin America | 0.0 /100 | #330 | Tragic 96.5% |
| Immigrants | Armenia | 0.0 /100 | #331 | Tragic 96.5% |
| Bangladeshis | 0.0 /100 | #332 | Tragic 96.5% |
| Immigrants | Dominican Republic | 0.0 /100 | #333 | Tragic 96.4% |
| Central Americans | 0.0 /100 | #334 | Tragic 96.4% |
| Yakama | 0.0 /100 | #335 | Tragic 96.4% |
| Immigrants | Fiji | 0.0 /100 | #336 | Tragic 96.4% |
| Immigrants | Cambodia | 0.0 /100 | #337 | Tragic 96.4% |
| Immigrants | Cabo Verde | 0.0 /100 | #338 | Tragic 96.3% |
| Guatemalans | 0.0 /100 | #339 | Tragic 96.3% |
| Immigrants | Guatemala | 0.0 /100 | #340 | Tragic 96.2% |
| Immigrants | Central America | 0.0 /100 | #341 | Tragic 96.2% |
| Immigrants | Mexico | 0.0 /100 | #342 | Tragic 96.1% |
| Nepalese | 0.0 /100 | #343 | Tragic 96.1% |
| Salvadorans | 0.0 /100 | #344 | Tragic 96.0% |
Demographics Similar to Senegalese by 2nd Grade
In terms of 2nd grade, the demographic groups most similar to Senegalese are Immigrants from Costa Rica (97.6%, a difference of 0.0%), Subsaharan African (97.6%, a difference of 0.010%), Immigrants from Syria (97.6%, a difference of 0.020%), Immigrants from Nepal (97.6%, a difference of 0.020%), and Immigrants from Pakistan (97.6%, a difference of 0.020%).
| Demographics | Rating | Rank | 2nd Grade |
| Sierra Leoneans | 4.3 /100 | #223 | Tragic 97.6% |
| Immigrants | Zaire | 4.3 /100 | #224 | Tragic 97.6% |
| Tongans | 4.3 /100 | #225 | Tragic 97.6% |
| Immigrants | Syria | 4.0 /100 | #226 | Tragic 97.6% |
| Immigrants | Nepal | 4.0 /100 | #227 | Tragic 97.6% |
| Sub-Saharan Africans | 3.4 /100 | #228 | Tragic 97.6% |
| Immigrants | Costa Rica | 3.1 /100 | #229 | Tragic 97.6% |
| Senegalese | 3.1 /100 | #230 | Tragic 97.6% |
| Immigrants | Pakistan | 2.3 /100 | #231 | Tragic 97.6% |
| Immigrants | Western Asia | 2.1 /100 | #232 | Tragic 97.6% |
| Immigrants | Uruguay | 2.1 /100 | #233 | Tragic 97.6% |
| Immigrants | Malaysia | 2.0 /100 | #234 | Tragic 97.6% |
| Colombians | 1.9 /100 | #235 | Tragic 97.6% |
| Nigerians | 1.7 /100 | #236 | Tragic 97.6% |
| U.S. Virgin Islanders | 1.6 /100 | #237 | Tragic 97.6% |