Thai vs Immigrants from Turkey High School Diploma
COMPARE
Thai
Immigrants from Turkey
High School Diploma
High School Diploma Comparison
Thais
Immigrants from Turkey
91.5%
HIGH SCHOOL DIPLOMA
99.9/ 100
METRIC RATING
25th/ 347
METRIC RANK
90.6%
HIGH SCHOOL DIPLOMA
98.9/ 100
METRIC RATING
87th/ 347
METRIC RANK
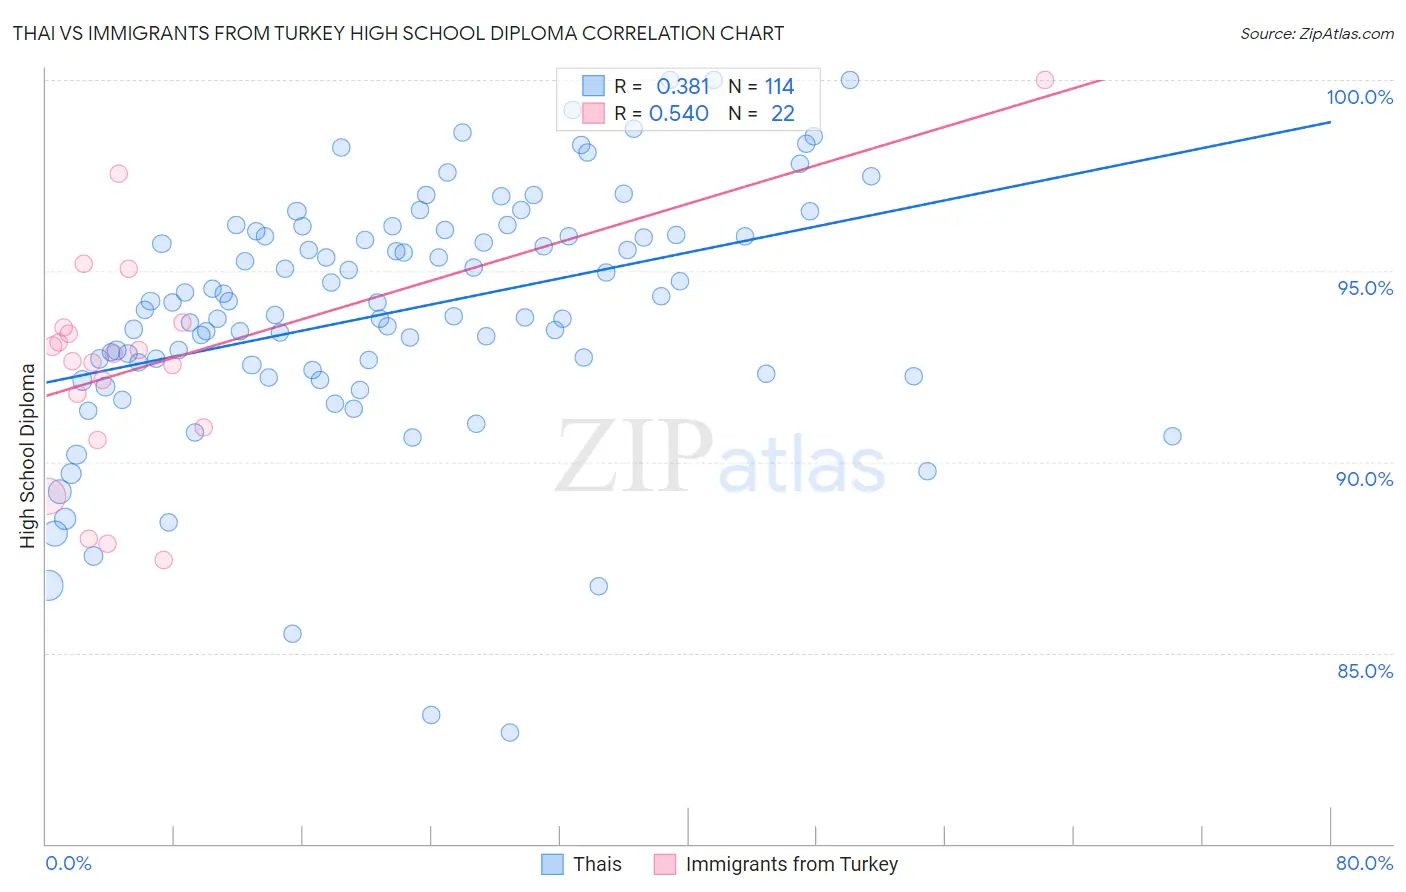
Thai vs Immigrants from Turkey High School Diploma Correlation Chart
The statistical analysis conducted on geographies consisting of 475,814,962 people shows a mild positive correlation between the proportion of Thais and percentage of population with at least high school diploma education in the United States with a correlation coefficient (R) of 0.381 and weighted average of 91.5%. Similarly, the statistical analysis conducted on geographies consisting of 223,057,877 people shows a substantial positive correlation between the proportion of Immigrants from Turkey and percentage of population with at least high school diploma education in the United States with a correlation coefficient (R) of 0.540 and weighted average of 90.6%, a difference of 0.98%.
High School Diploma Correlation Summary
| Measurement | Thai | Immigrants from Turkey |
| Minimum | 82.9% | 87.4% |
| Maximum | 100.0% | 100.0% |
| Range | 17.1% | 12.6% |
| Mean | 93.9% | 92.5% |
| Median | 94.2% | 92.7% |
| Interquartile 25% (IQ1) | 92.4% | 90.9% |
| Interquartile 75% (IQ3) | 95.9% | 93.5% |
| Interquartile Range (IQR) | 3.5% | 2.6% |
| Standard Deviation (Sample) | 3.2% | 3.0% |
| Standard Deviation (Population) | 3.2% | 2.9% |
Similar Demographics by High School Diploma
Demographics Similar to Thais by High School Diploma
In terms of high school diploma, the demographic groups most similar to Thais are Scandinavian (91.5%, a difference of 0.0%), Italian (91.5%, a difference of 0.0%), Estonian (91.6%, a difference of 0.030%), Czech (91.6%, a difference of 0.050%), and Filipino (91.6%, a difference of 0.050%).
| Demographics | Rating | Rank | High School Diploma |
| Germans | 99.9 /100 | #18 | Exceptional 91.7% |
| Maltese | 99.9 /100 | #19 | Exceptional 91.6% |
| Czechs | 99.9 /100 | #20 | Exceptional 91.6% |
| Filipinos | 99.9 /100 | #21 | Exceptional 91.6% |
| Estonians | 99.9 /100 | #22 | Exceptional 91.6% |
| Scandinavians | 99.9 /100 | #23 | Exceptional 91.5% |
| Italians | 99.9 /100 | #24 | Exceptional 91.5% |
| Thais | 99.9 /100 | #25 | Exceptional 91.5% |
| Russians | 99.9 /100 | #26 | Exceptional 91.5% |
| Cypriots | 99.9 /100 | #27 | Exceptional 91.5% |
| Tlingit-Haida | 99.9 /100 | #28 | Exceptional 91.4% |
| Europeans | 99.9 /100 | #29 | Exceptional 91.4% |
| Iranians | 99.9 /100 | #30 | Exceptional 91.4% |
| Immigrants | Northern Europe | 99.9 /100 | #31 | Exceptional 91.4% |
| English | 99.9 /100 | #32 | Exceptional 91.4% |
Demographics Similar to Immigrants from Turkey by High School Diploma
In terms of high school diploma, the demographic groups most similar to Immigrants from Turkey are Immigrants from Bulgaria (90.6%, a difference of 0.0%), Romanian (90.7%, a difference of 0.010%), Immigrants from France (90.6%, a difference of 0.020%), Canadian (90.6%, a difference of 0.040%), and Celtic (90.6%, a difference of 0.050%).
| Demographics | Rating | Rank | High School Diploma |
| Immigrants | England | 99.3 /100 | #80 | Exceptional 90.8% |
| Immigrants | Switzerland | 99.3 /100 | #81 | Exceptional 90.8% |
| Scotch-Irish | 99.2 /100 | #82 | Exceptional 90.8% |
| Immigrants | Moldova | 99.2 /100 | #83 | Exceptional 90.7% |
| Immigrants | Saudi Arabia | 99.1 /100 | #84 | Exceptional 90.7% |
| Romanians | 98.9 /100 | #85 | Exceptional 90.7% |
| Immigrants | Bulgaria | 98.9 /100 | #86 | Exceptional 90.6% |
| Immigrants | Turkey | 98.9 /100 | #87 | Exceptional 90.6% |
| Immigrants | France | 98.8 /100 | #88 | Exceptional 90.6% |
| Canadians | 98.7 /100 | #89 | Exceptional 90.6% |
| Celtics | 98.7 /100 | #90 | Exceptional 90.6% |
| South Africans | 98.6 /100 | #91 | Exceptional 90.6% |
| Swiss | 98.6 /100 | #92 | Exceptional 90.6% |
| Immigrants | Western Europe | 98.6 /100 | #93 | Exceptional 90.6% |
| Immigrants | Israel | 98.5 /100 | #94 | Exceptional 90.5% |