Immigrants from Sweden vs Paraguayan Bachelor's Degree
COMPARE
Immigrants from Sweden
Paraguayan
Bachelor's Degree
Bachelor's Degree Comparison
Immigrants from Sweden
Paraguayans
47.0%
BACHELOR'S DEGREE
100.0/ 100
METRIC RATING
23rd/ 347
METRIC RANK
44.0%
BACHELOR'S DEGREE
99.9/ 100
METRIC RATING
57th/ 347
METRIC RANK
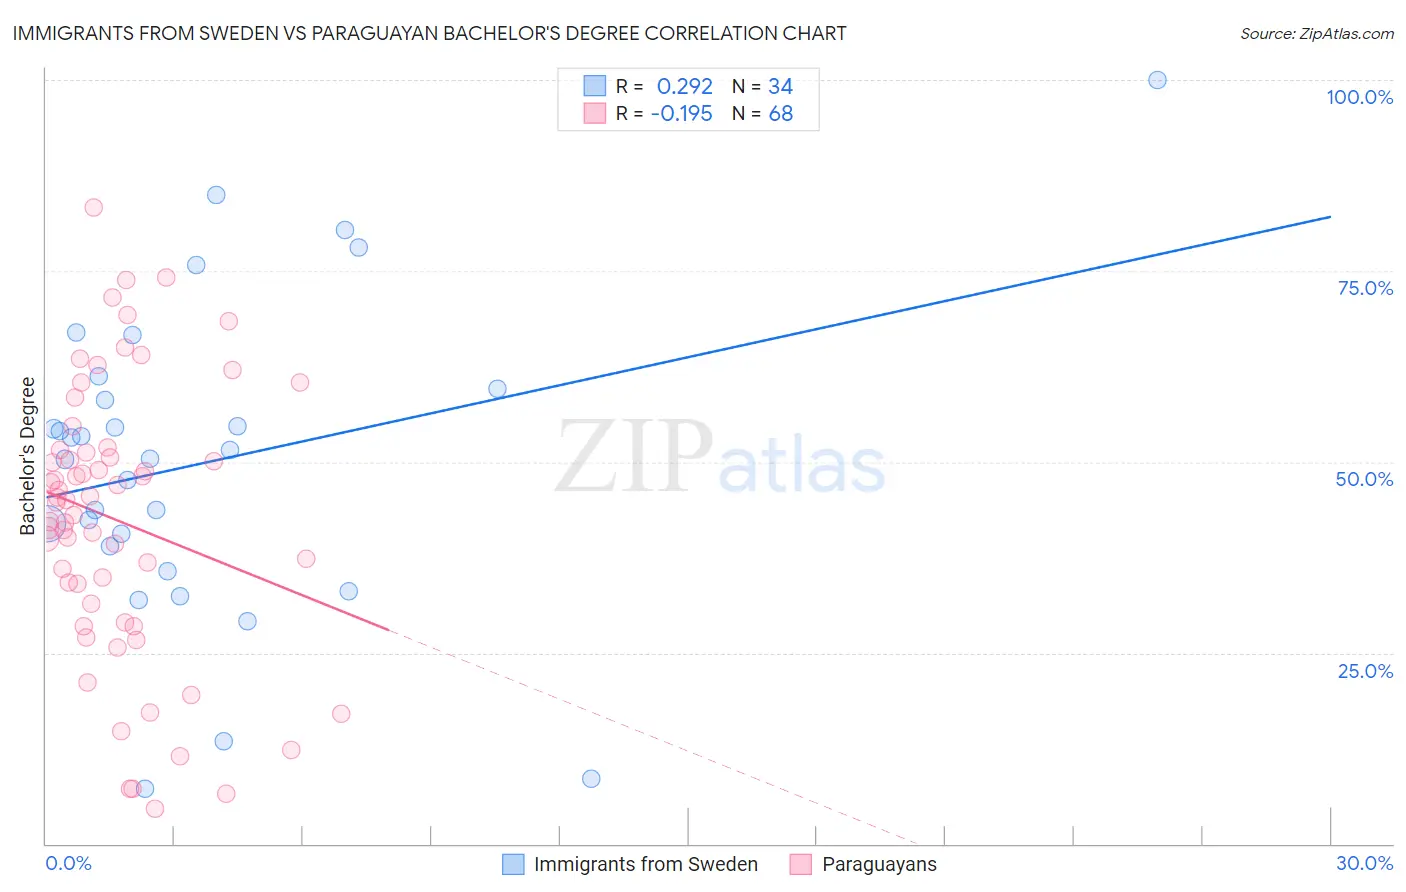
Immigrants from Sweden vs Paraguayan Bachelor's Degree Correlation Chart
The statistical analysis conducted on geographies consisting of 164,727,727 people shows a weak positive correlation between the proportion of Immigrants from Sweden and percentage of population with at least bachelor's degree education in the United States with a correlation coefficient (R) of 0.292 and weighted average of 47.0%. Similarly, the statistical analysis conducted on geographies consisting of 95,113,072 people shows a poor negative correlation between the proportion of Paraguayans and percentage of population with at least bachelor's degree education in the United States with a correlation coefficient (R) of -0.195 and weighted average of 44.0%, a difference of 6.7%.
Bachelor's Degree Correlation Summary
| Measurement | Immigrants from Sweden | Paraguayan |
| Minimum | 7.1% | 4.5% |
| Maximum | 100.0% | 83.2% |
| Range | 92.9% | 78.7% |
| Mean | 49.9% | 42.3% |
| Median | 51.0% | 44.9% |
| Interquartile 25% (IQ1) | 39.0% | 30.2% |
| Interquartile 75% (IQ3) | 59.6% | 51.4% |
| Interquartile Range (IQR) | 20.6% | 21.2% |
| Standard Deviation (Sample) | 20.5% | 18.1% |
| Standard Deviation (Population) | 20.2% | 17.9% |
Similar Demographics by Bachelor's Degree
Demographics Similar to Immigrants from Sweden by Bachelor's Degree
In terms of bachelor's degree, the demographic groups most similar to Immigrants from Sweden are Immigrants from Korea (47.0%, a difference of 0.040%), Immigrants from Belgium (47.0%, a difference of 0.090%), Burmese (46.9%, a difference of 0.26%), Immigrants from Ireland (47.1%, a difference of 0.29%), and Immigrants from Switzerland (47.1%, a difference of 0.30%).
| Demographics | Rating | Rank | Bachelor's Degree |
| Soviet Union | 100.0 /100 | #16 | Exceptional 47.9% |
| Eastern Europeans | 100.0 /100 | #17 | Exceptional 47.5% |
| Indians (Asian) | 100.0 /100 | #18 | Exceptional 47.4% |
| Cambodians | 100.0 /100 | #19 | Exceptional 47.2% |
| Immigrants | Switzerland | 100.0 /100 | #20 | Exceptional 47.1% |
| Immigrants | Ireland | 100.0 /100 | #21 | Exceptional 47.1% |
| Immigrants | Belgium | 100.0 /100 | #22 | Exceptional 47.0% |
| Immigrants | Sweden | 100.0 /100 | #23 | Exceptional 47.0% |
| Immigrants | Korea | 100.0 /100 | #24 | Exceptional 47.0% |
| Burmese | 100.0 /100 | #25 | Exceptional 46.9% |
| Immigrants | Japan | 100.0 /100 | #26 | Exceptional 46.8% |
| Immigrants | France | 100.0 /100 | #27 | Exceptional 46.4% |
| Turks | 100.0 /100 | #28 | Exceptional 46.2% |
| Israelis | 100.0 /100 | #29 | Exceptional 46.1% |
| Immigrants | Sri Lanka | 100.0 /100 | #30 | Exceptional 46.1% |
Demographics Similar to Paraguayans by Bachelor's Degree
In terms of bachelor's degree, the demographic groups most similar to Paraguayans are Immigrants from Czechoslovakia (44.0%, a difference of 0.050%), Australian (44.0%, a difference of 0.16%), New Zealander (44.0%, a difference of 0.16%), Immigrants from Serbia (44.1%, a difference of 0.19%), and Immigrants from Austria (44.2%, a difference of 0.37%).
| Demographics | Rating | Rank | Bachelor's Degree |
| Immigrants | Greece | 99.9 /100 | #50 | Exceptional 44.5% |
| Asians | 99.9 /100 | #51 | Exceptional 44.4% |
| Immigrants | Spain | 99.9 /100 | #52 | Exceptional 44.3% |
| Immigrants | Asia | 99.9 /100 | #53 | Exceptional 44.3% |
| Immigrants | Austria | 99.9 /100 | #54 | Exceptional 44.2% |
| Immigrants | Bolivia | 99.9 /100 | #55 | Exceptional 44.2% |
| Immigrants | Serbia | 99.9 /100 | #56 | Exceptional 44.1% |
| Paraguayans | 99.9 /100 | #57 | Exceptional 44.0% |
| Immigrants | Czechoslovakia | 99.9 /100 | #58 | Exceptional 44.0% |
| Australians | 99.9 /100 | #59 | Exceptional 44.0% |
| New Zealanders | 99.9 /100 | #60 | Exceptional 44.0% |
| South Africans | 99.8 /100 | #61 | Exceptional 43.6% |
| Immigrants | Kazakhstan | 99.8 /100 | #62 | Exceptional 43.4% |
| Immigrants | Europe | 99.8 /100 | #63 | Exceptional 43.4% |
| Argentineans | 99.7 /100 | #64 | Exceptional 43.3% |