Immigrants from Sudan vs Immigrants from Pakistan Doctorate Degree
COMPARE
Immigrants from Sudan
Immigrants from Pakistan
Doctorate Degree
Doctorate Degree Comparison
Immigrants from Sudan
Immigrants from Pakistan
2.2%
DOCTORATE DEGREE
99.1/ 100
METRIC RATING
91st/ 347
METRIC RANK
2.1%
DOCTORATE DEGREE
97.1/ 100
METRIC RATING
111th/ 347
METRIC RANK
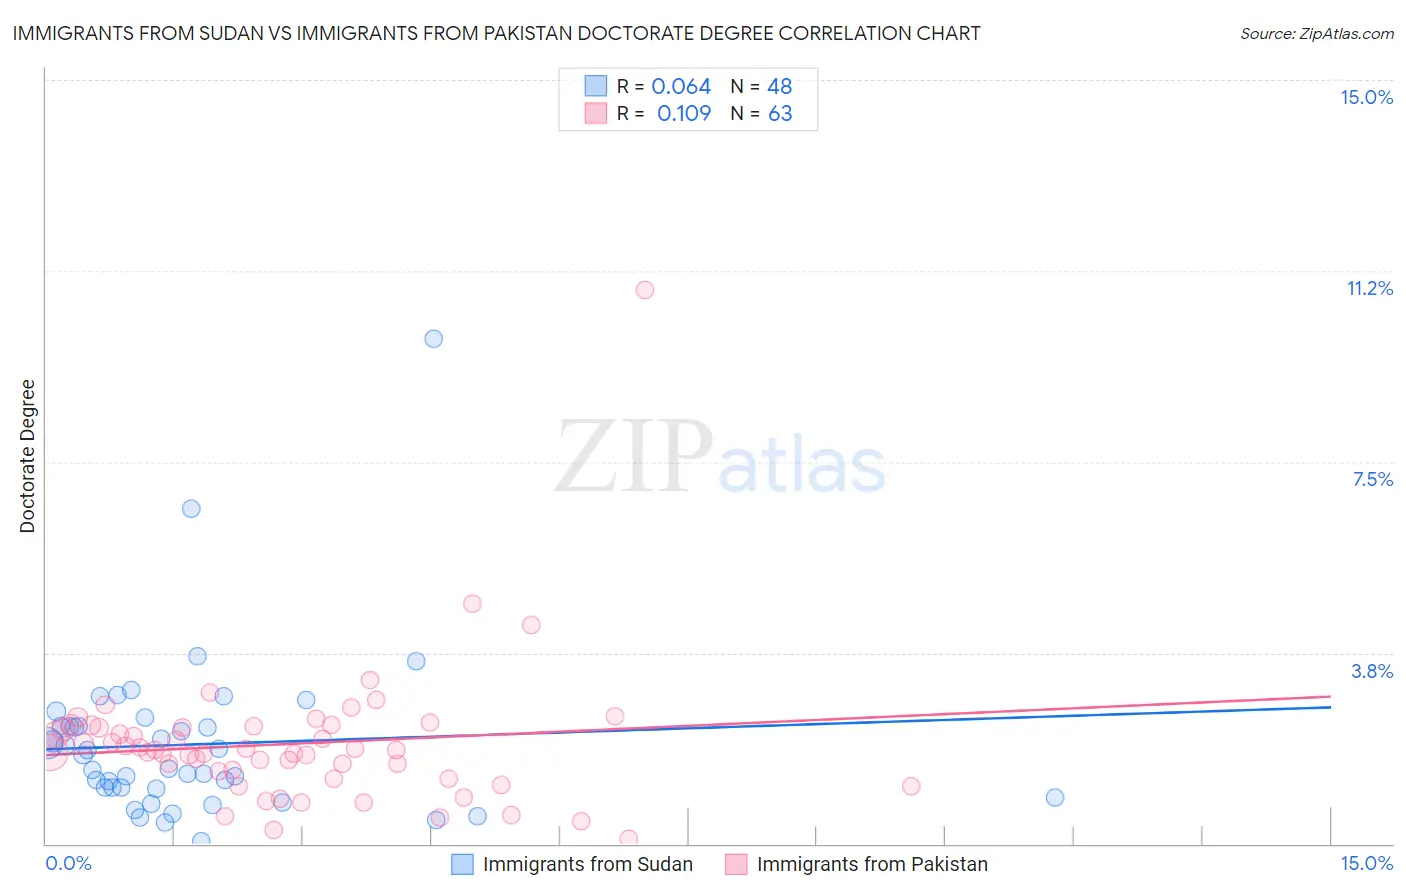
Immigrants from Sudan vs Immigrants from Pakistan Doctorate Degree Correlation Chart
The statistical analysis conducted on geographies consisting of 118,716,469 people shows a slight positive correlation between the proportion of Immigrants from Sudan and percentage of population with at least doctorate degree education in the United States with a correlation coefficient (R) of 0.064 and weighted average of 2.2%. Similarly, the statistical analysis conducted on geographies consisting of 283,055,701 people shows a poor positive correlation between the proportion of Immigrants from Pakistan and percentage of population with at least doctorate degree education in the United States with a correlation coefficient (R) of 0.109 and weighted average of 2.1%, a difference of 3.9%.
Doctorate Degree Correlation Summary
| Measurement | Immigrants from Sudan | Immigrants from Pakistan |
| Minimum | 0.039% | 0.090% |
| Maximum | 9.9% | 10.9% |
| Range | 9.9% | 10.8% |
| Mean | 1.9% | 2.0% |
| Median | 1.6% | 1.8% |
| Interquartile 25% (IQ1) | 1.1% | 1.3% |
| Interquartile 75% (IQ3) | 2.3% | 2.3% |
| Interquartile Range (IQR) | 1.2% | 1.0% |
| Standard Deviation (Sample) | 1.6% | 1.4% |
| Standard Deviation (Population) | 1.6% | 1.4% |
Demographics Similar to Immigrants from Sudan and Immigrants from Pakistan by Doctorate Degree
In terms of doctorate degree, the demographic groups most similar to Immigrants from Sudan are Chilean (2.2%, a difference of 0.26%), Alsatian (2.1%, a difference of 0.48%), Greek (2.1%, a difference of 1.1%), Immigrants from Romania (2.1%, a difference of 1.3%), and Immigrants from Northern Africa (2.1%, a difference of 1.9%). Similarly, the demographic groups most similar to Immigrants from Pakistan are Brazilian (2.1%, a difference of 0.060%), Ukrainian (2.1%, a difference of 0.13%), Immigrants from Germany (2.1%, a difference of 0.19%), European (2.1%, a difference of 0.41%), and Sudanese (2.1%, a difference of 0.81%).
| Demographics | Rating | Rank | Doctorate Degree |
| Immigrants | Sudan | 99.1 /100 | #91 | Exceptional 2.2% |
| Chileans | 99.1 /100 | #92 | Exceptional 2.2% |
| Alsatians | 99.0 /100 | #93 | Exceptional 2.1% |
| Greeks | 98.8 /100 | #94 | Exceptional 2.1% |
| Immigrants | Romania | 98.7 /100 | #95 | Exceptional 2.1% |
| Immigrants | Northern Africa | 98.4 /100 | #96 | Exceptional 2.1% |
| Immigrants | Eritrea | 98.4 /100 | #97 | Exceptional 2.1% |
| Armenians | 98.3 /100 | #98 | Exceptional 2.1% |
| Immigrants | Egypt | 98.2 /100 | #99 | Exceptional 2.1% |
| Immigrants | Eastern Europe | 98.2 /100 | #100 | Exceptional 2.1% |
| Immigrants | Eastern Africa | 98.2 /100 | #101 | Exceptional 2.1% |
| Immigrants | Chile | 98.1 /100 | #102 | Exceptional 2.1% |
| Romanians | 98.1 /100 | #103 | Exceptional 2.1% |
| Austrians | 98.0 /100 | #104 | Exceptional 2.1% |
| Arabs | 97.8 /100 | #105 | Exceptional 2.1% |
| Sudanese | 97.7 /100 | #106 | Exceptional 2.1% |
| Europeans | 97.5 /100 | #107 | Exceptional 2.1% |
| Immigrants | Germany | 97.3 /100 | #108 | Exceptional 2.1% |
| Ukrainians | 97.2 /100 | #109 | Exceptional 2.1% |
| Brazilians | 97.2 /100 | #110 | Exceptional 2.1% |
| Immigrants | Pakistan | 97.1 /100 | #111 | Exceptional 2.1% |