Immigrants from Sudan vs Bahamian 5th Grade
COMPARE
Immigrants from Sudan
Bahamian
5th Grade
5th Grade Comparison
Immigrants from Sudan
Bahamians
97.1%
5TH GRADE
6.5/ 100
METRIC RATING
218th/ 347
METRIC RANK
97.0%
5TH GRADE
5.3/ 100
METRIC RATING
225th/ 347
METRIC RANK
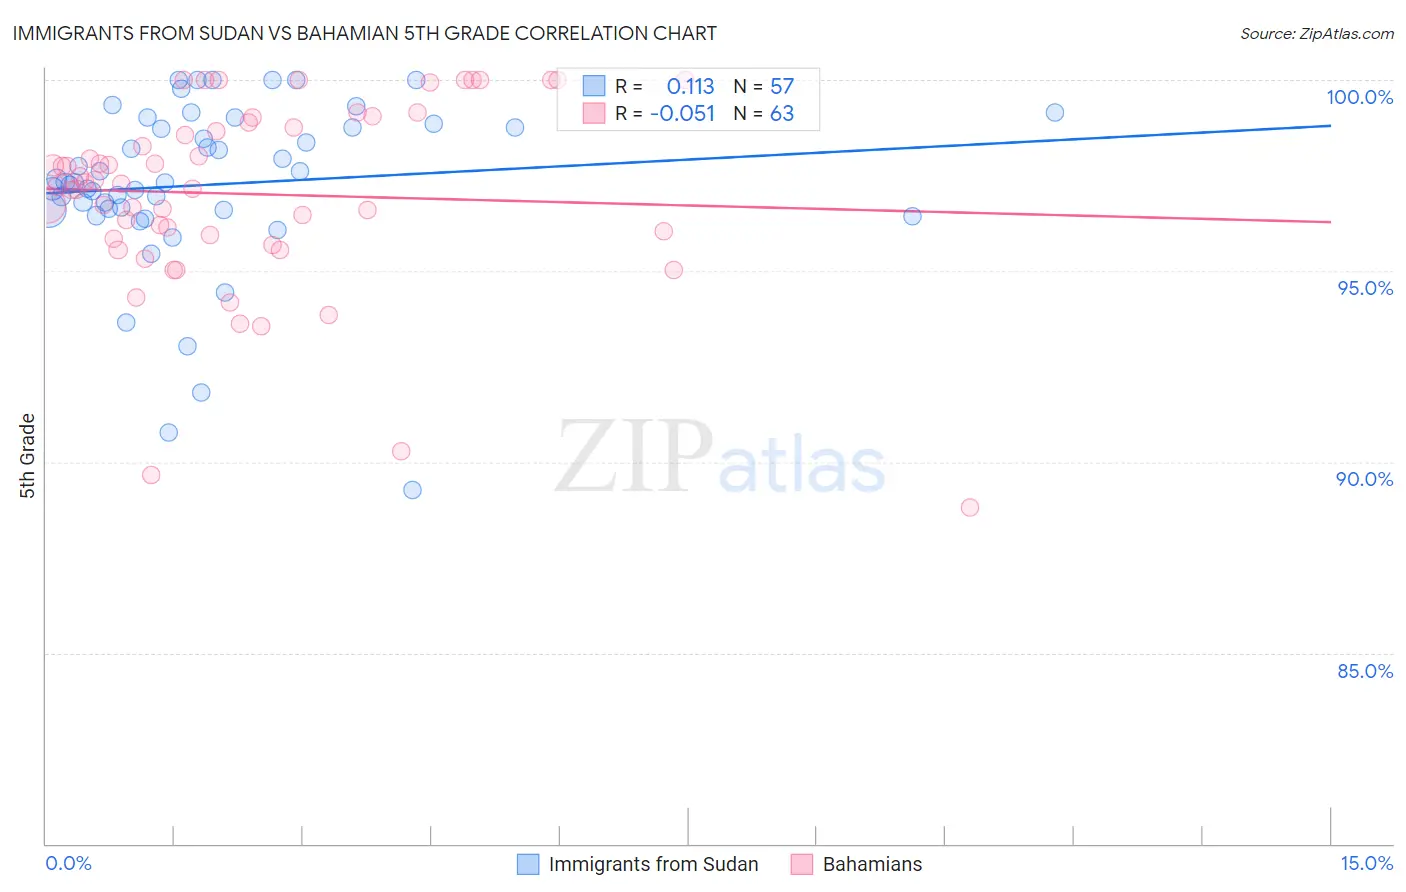
Immigrants from Sudan vs Bahamian 5th Grade Correlation Chart
The statistical analysis conducted on geographies consisting of 118,959,807 people shows a poor positive correlation between the proportion of Immigrants from Sudan and percentage of population with at least 5th grade education in the United States with a correlation coefficient (R) of 0.113 and weighted average of 97.1%. Similarly, the statistical analysis conducted on geographies consisting of 112,698,819 people shows a slight negative correlation between the proportion of Bahamians and percentage of population with at least 5th grade education in the United States with a correlation coefficient (R) of -0.051 and weighted average of 97.0%, a difference of 0.020%.
5th Grade Correlation Summary
| Measurement | Immigrants from Sudan | Bahamian |
| Minimum | 89.3% | 88.8% |
| Maximum | 100.0% | 100.0% |
| Range | 10.7% | 11.2% |
| Mean | 97.3% | 97.0% |
| Median | 97.3% | 97.3% |
| Interquartile 25% (IQ1) | 96.6% | 95.8% |
| Interquartile 75% (IQ3) | 98.8% | 98.9% |
| Interquartile Range (IQR) | 2.2% | 3.1% |
| Standard Deviation (Sample) | 2.2% | 2.5% |
| Standard Deviation (Population) | 2.2% | 2.4% |
Demographics Similar to Immigrants from Sudan and Bahamians by 5th Grade
In terms of 5th grade, the demographic groups most similar to Immigrants from Sudan are Immigrants from Lebanon (97.1%, a difference of 0.0%), Immigrants from Syria (97.1%, a difference of 0.0%), Immigrants from Southern Europe (97.1%, a difference of 0.0%), Immigrants from Morocco (97.1%, a difference of 0.010%), and Sudanese (97.1%, a difference of 0.010%). Similarly, the demographic groups most similar to Bahamians are South American Indian (97.0%, a difference of 0.0%), Tongan (97.0%, a difference of 0.0%), Sierra Leonean (97.1%, a difference of 0.010%), Immigrants from Panama (97.0%, a difference of 0.010%), and Liberian (97.0%, a difference of 0.010%).
| Demographics | Rating | Rank | 5th Grade |
| Samoans | 8.5 /100 | #211 | Tragic 97.1% |
| Immigrants | Iraq | 8.3 /100 | #212 | Tragic 97.1% |
| Portuguese | 7.8 /100 | #213 | Tragic 97.1% |
| Costa Ricans | 7.7 /100 | #214 | Tragic 97.1% |
| Immigrants | Morocco | 7.5 /100 | #215 | Tragic 97.1% |
| Sudanese | 7.0 /100 | #216 | Tragic 97.1% |
| Immigrants | Lebanon | 6.8 /100 | #217 | Tragic 97.1% |
| Immigrants | Sudan | 6.5 /100 | #218 | Tragic 97.1% |
| Immigrants | Syria | 6.4 /100 | #219 | Tragic 97.1% |
| Immigrants | Southern Europe | 6.3 /100 | #220 | Tragic 97.1% |
| Sierra Leoneans | 6.0 /100 | #221 | Tragic 97.1% |
| Immigrants | Panama | 5.7 /100 | #222 | Tragic 97.0% |
| Liberians | 5.7 /100 | #223 | Tragic 97.0% |
| South American Indians | 5.4 /100 | #224 | Tragic 97.0% |
| Bahamians | 5.3 /100 | #225 | Tragic 97.0% |
| Tongans | 5.3 /100 | #226 | Tragic 97.0% |
| Immigrants | Pakistan | 4.7 /100 | #227 | Tragic 97.0% |
| Assyrians/Chaldeans/Syriacs | 4.5 /100 | #228 | Tragic 97.0% |
| Yuman | 4.5 /100 | #229 | Tragic 97.0% |
| Immigrants | Western Asia | 4.3 /100 | #230 | Tragic 97.0% |
| Immigrants | Malaysia | 4.1 /100 | #231 | Tragic 97.0% |