Immigrants from St. Vincent and the Grenadines vs Eastern European 12th Grade, No Diploma
COMPARE
Immigrants from St. Vincent and the Grenadines
Eastern European
12th Grade, No Diploma
12th Grade, No Diploma Comparison
Immigrants from St. Vincent and the Grenadines
Eastern Europeans
88.9%
12TH GRADE, NO DIPLOMA
0.0/ 100
METRIC RATING
278th/ 347
METRIC RANK
93.5%
12TH GRADE, NO DIPLOMA
100.0/ 100
METRIC RATING
12th/ 347
METRIC RANK
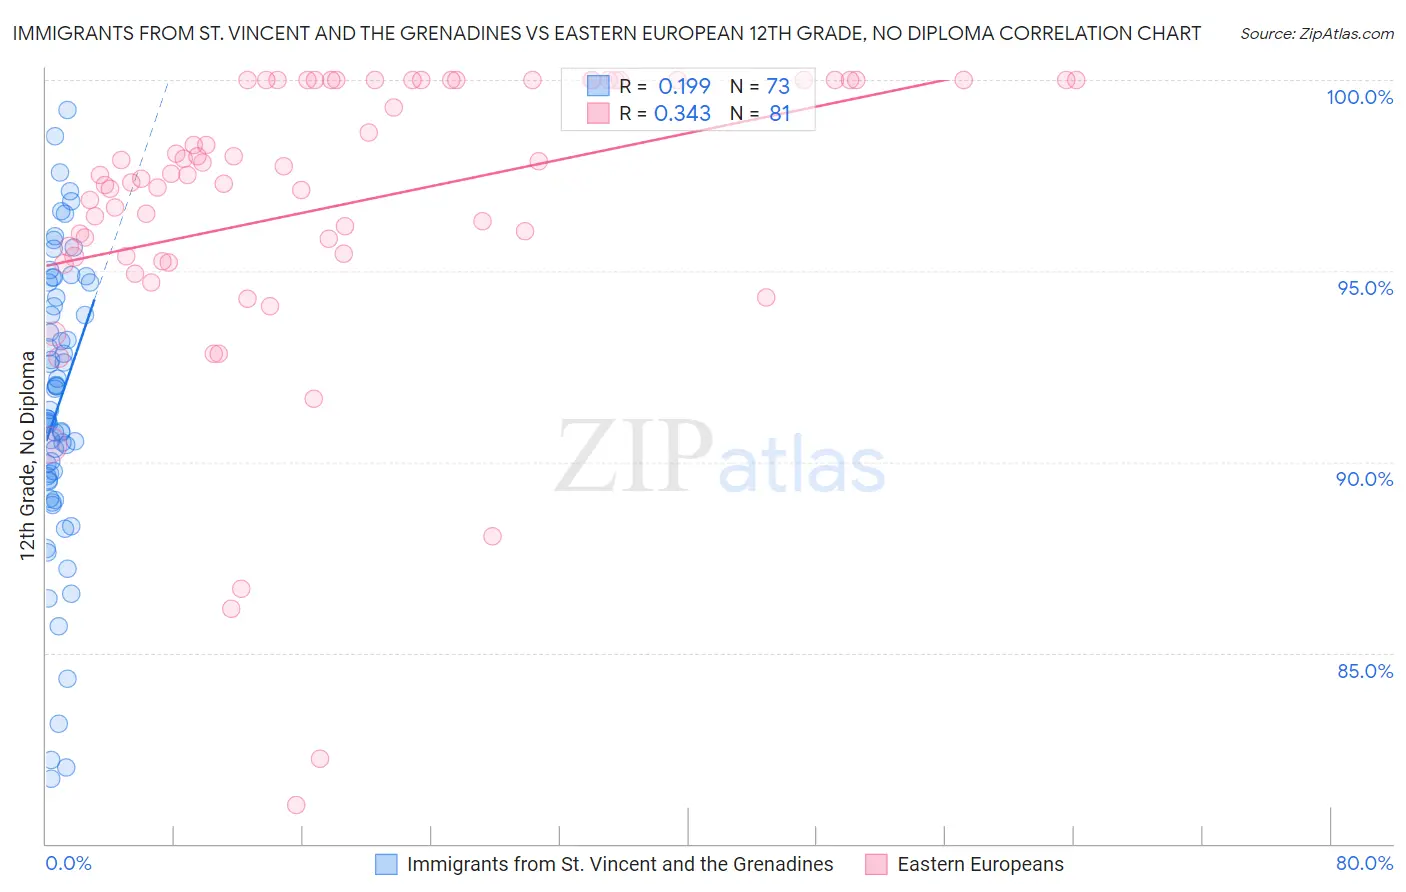
Immigrants from St. Vincent and the Grenadines vs Eastern European 12th Grade, No Diploma Correlation Chart
The statistical analysis conducted on geographies consisting of 56,191,418 people shows a poor positive correlation between the proportion of Immigrants from St. Vincent and the Grenadines and percentage of population with at least 12th grade (no diploma) education in the United States with a correlation coefficient (R) of 0.199 and weighted average of 88.9%. Similarly, the statistical analysis conducted on geographies consisting of 461,247,615 people shows a mild positive correlation between the proportion of Eastern Europeans and percentage of population with at least 12th grade (no diploma) education in the United States with a correlation coefficient (R) of 0.343 and weighted average of 93.5%, a difference of 5.1%.
12th Grade, No Diploma Correlation Summary
| Measurement | Immigrants from St. Vincent and the Grenadines | Eastern European |
| Minimum | 81.7% | 81.0% |
| Maximum | 99.2% | 100.0% |
| Range | 17.5% | 19.0% |
| Mean | 91.4% | 96.7% |
| Median | 91.1% | 97.5% |
| Interquartile 25% (IQ1) | 89.5% | 95.4% |
| Interquartile 75% (IQ3) | 94.5% | 100.0% |
| Interquartile Range (IQR) | 5.0% | 4.6% |
| Standard Deviation (Sample) | 3.8% | 3.9% |
| Standard Deviation (Population) | 3.8% | 3.9% |
Similar Demographics by 12th Grade, No Diploma
Demographics Similar to Immigrants from St. Vincent and the Grenadines by 12th Grade, No Diploma
In terms of 12th grade, no diploma, the demographic groups most similar to Immigrants from St. Vincent and the Grenadines are Immigrants from Barbados (89.0%, a difference of 0.060%), Immigrants from Laos (88.9%, a difference of 0.070%), Immigrants from Burma/Myanmar (88.9%, a difference of 0.070%), Cuban (88.9%, a difference of 0.080%), and Immigrants from Congo (89.0%, a difference of 0.12%).
| Demographics | Rating | Rank | 12th Grade, No Diploma |
| Blacks/African Americans | 0.1 /100 | #271 | Tragic 89.3% |
| Malaysians | 0.1 /100 | #272 | Tragic 89.2% |
| Barbadians | 0.1 /100 | #273 | Tragic 89.1% |
| Cajuns | 0.1 /100 | #274 | Tragic 89.1% |
| Immigrants | Congo | 0.1 /100 | #275 | Tragic 89.0% |
| Ute | 0.1 /100 | #276 | Tragic 89.0% |
| Immigrants | Barbados | 0.0 /100 | #277 | Tragic 89.0% |
| Immigrants | St. Vincent and the Grenadines | 0.0 /100 | #278 | Tragic 88.9% |
| Immigrants | Laos | 0.0 /100 | #279 | Tragic 88.9% |
| Immigrants | Burma/Myanmar | 0.0 /100 | #280 | Tragic 88.9% |
| Cubans | 0.0 /100 | #281 | Tragic 88.9% |
| Immigrants | Vietnam | 0.0 /100 | #282 | Tragic 88.7% |
| Paiute | 0.0 /100 | #283 | Tragic 88.7% |
| Pennsylvania Germans | 0.0 /100 | #284 | Tragic 88.7% |
| Indonesians | 0.0 /100 | #285 | Tragic 88.6% |
Demographics Similar to Eastern Europeans by 12th Grade, No Diploma
In terms of 12th grade, no diploma, the demographic groups most similar to Eastern Europeans are Polish (93.5%, a difference of 0.010%), Danish (93.5%, a difference of 0.020%), Bulgarian (93.5%, a difference of 0.040%), Croatian (93.5%, a difference of 0.060%), and Latvian (93.6%, a difference of 0.090%).
| Demographics | Rating | Rank | 12th Grade, No Diploma |
| Carpatho Rusyns | 100.0 /100 | #5 | Exceptional 93.6% |
| Immigrants | India | 100.0 /100 | #6 | Exceptional 93.6% |
| Slovaks | 100.0 /100 | #7 | Exceptional 93.6% |
| Chinese | 100.0 /100 | #8 | Exceptional 93.6% |
| Latvians | 100.0 /100 | #9 | Exceptional 93.6% |
| Croatians | 100.0 /100 | #10 | Exceptional 93.5% |
| Poles | 100.0 /100 | #11 | Exceptional 93.5% |
| Eastern Europeans | 100.0 /100 | #12 | Exceptional 93.5% |
| Danes | 100.0 /100 | #13 | Exceptional 93.5% |
| Bulgarians | 100.0 /100 | #14 | Exceptional 93.5% |
| Finns | 100.0 /100 | #15 | Exceptional 93.4% |
| Maltese | 100.0 /100 | #16 | Exceptional 93.3% |
| Luxembourgers | 100.0 /100 | #17 | Exceptional 93.3% |
| Immigrants | Singapore | 99.9 /100 | #18 | Exceptional 93.3% |
| Germans | 99.9 /100 | #19 | Exceptional 93.3% |