Immigrants from St. Vincent and the Grenadines vs Czechoslovakian 2nd Grade
COMPARE
Immigrants from St. Vincent and the Grenadines
Czechoslovakian
2nd Grade
2nd Grade Comparison
Immigrants from St. Vincent and the Grenadines
Czechoslovakians
97.2%
2ND GRADE
0.0/ 100
METRIC RATING
290th/ 347
METRIC RANK
98.4%
2ND GRADE
99.9/ 100
METRIC RATING
48th/ 347
METRIC RANK
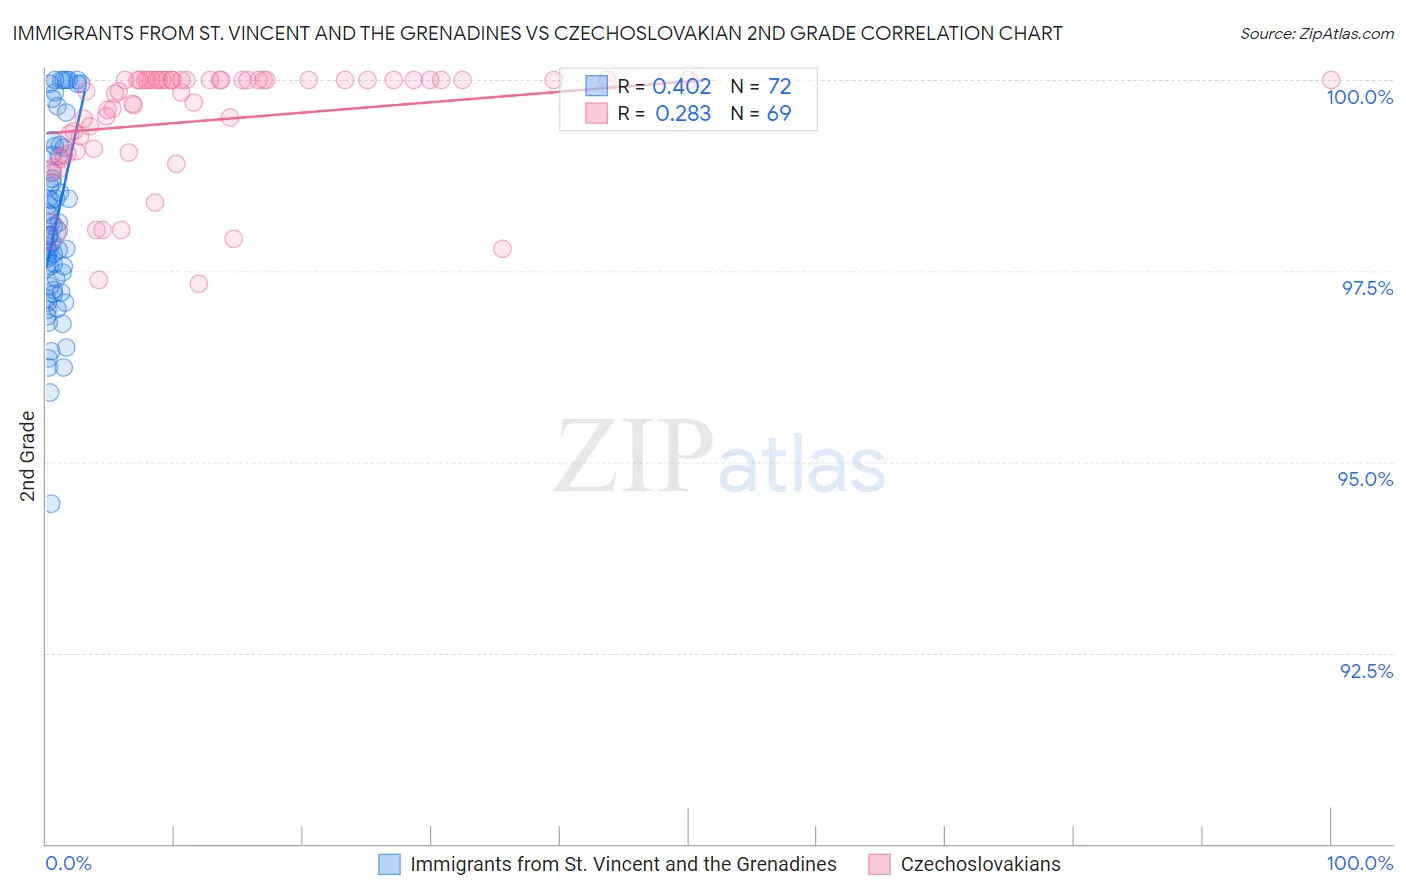
Immigrants from St. Vincent and the Grenadines vs Czechoslovakian 2nd Grade Correlation Chart
The statistical analysis conducted on geographies consisting of 56,176,062 people shows a moderate positive correlation between the proportion of Immigrants from St. Vincent and the Grenadines and percentage of population with at least 2nd grade education in the United States with a correlation coefficient (R) of 0.402 and weighted average of 97.2%. Similarly, the statistical analysis conducted on geographies consisting of 368,668,876 people shows a weak positive correlation between the proportion of Czechoslovakians and percentage of population with at least 2nd grade education in the United States with a correlation coefficient (R) of 0.283 and weighted average of 98.4%, a difference of 1.2%.
2nd Grade Correlation Summary
| Measurement | Immigrants from St. Vincent and the Grenadines | Czechoslovakian |
| Minimum | 94.4% | 97.3% |
| Maximum | 100.0% | 100.0% |
| Range | 5.6% | 2.7% |
| Mean | 98.1% | 99.5% |
| Median | 98.0% | 99.9% |
| Interquartile 25% (IQ1) | 97.3% | 99.1% |
| Interquartile 75% (IQ3) | 99.0% | 100.0% |
| Interquartile Range (IQR) | 1.7% | 0.94% |
| Standard Deviation (Sample) | 1.2% | 0.73% |
| Standard Deviation (Population) | 1.2% | 0.73% |
Similar Demographics by 2nd Grade
Demographics Similar to Immigrants from St. Vincent and the Grenadines by 2nd Grade
In terms of 2nd grade, the demographic groups most similar to Immigrants from St. Vincent and the Grenadines are Houma (97.2%, a difference of 0.0%), Immigrants from Afghanistan (97.2%, a difference of 0.0%), Immigrants from Barbados (97.2%, a difference of 0.020%), Immigrants from Portugal (97.2%, a difference of 0.020%), and Immigrants from Thailand (97.2%, a difference of 0.020%).
| Demographics | Rating | Rank | 2nd Grade |
| Immigrants | Trinidad and Tobago | 0.0 /100 | #283 | Tragic 97.2% |
| Immigrants | West Indies | 0.0 /100 | #284 | Tragic 97.2% |
| Immigrants | Hong Kong | 0.0 /100 | #285 | Tragic 97.2% |
| Immigrants | Barbados | 0.0 /100 | #286 | Tragic 97.2% |
| Immigrants | Portugal | 0.0 /100 | #287 | Tragic 97.2% |
| Immigrants | Thailand | 0.0 /100 | #288 | Tragic 97.2% |
| Houma | 0.0 /100 | #289 | Tragic 97.2% |
| Immigrants | St. Vincent and the Grenadines | 0.0 /100 | #290 | Tragic 97.2% |
| Immigrants | Afghanistan | 0.0 /100 | #291 | Tragic 97.2% |
| Immigrants | Eritrea | 0.0 /100 | #292 | Tragic 97.2% |
| British West Indians | 0.0 /100 | #293 | Tragic 97.2% |
| Malaysians | 0.0 /100 | #294 | Tragic 97.1% |
| Immigrants | Grenada | 0.0 /100 | #295 | Tragic 97.1% |
| Immigrants | Immigrants | 0.0 /100 | #296 | Tragic 97.1% |
| Immigrants | Cuba | 0.0 /100 | #297 | Tragic 97.0% |
Demographics Similar to Czechoslovakians by 2nd Grade
In terms of 2nd grade, the demographic groups most similar to Czechoslovakians are Ottawa (98.4%, a difference of 0.0%), Lumbee (98.4%, a difference of 0.010%), Celtic (98.4%, a difference of 0.010%), White/Caucasian (98.4%, a difference of 0.010%), and Estonian (98.4%, a difference of 0.010%).
| Demographics | Rating | Rank | 2nd Grade |
| Eastern Europeans | 99.9 /100 | #41 | Exceptional 98.4% |
| Native Hawaiians | 99.9 /100 | #42 | Exceptional 98.4% |
| Belgians | 99.9 /100 | #43 | Exceptional 98.4% |
| Northern Europeans | 99.9 /100 | #44 | Exceptional 98.4% |
| Hungarians | 99.9 /100 | #45 | Exceptional 98.4% |
| Lumbee | 99.9 /100 | #46 | Exceptional 98.4% |
| Ottawa | 99.9 /100 | #47 | Exceptional 98.4% |
| Czechoslovakians | 99.9 /100 | #48 | Exceptional 98.4% |
| Celtics | 99.8 /100 | #49 | Exceptional 98.4% |
| Whites/Caucasians | 99.8 /100 | #50 | Exceptional 98.4% |
| Estonians | 99.8 /100 | #51 | Exceptional 98.4% |
| Australians | 99.8 /100 | #52 | Exceptional 98.4% |
| Pueblo | 99.8 /100 | #53 | Exceptional 98.3% |
| Kiowa | 99.8 /100 | #54 | Exceptional 98.3% |
| Immigrants | Scotland | 99.8 /100 | #55 | Exceptional 98.3% |