Immigrants from Sri Lanka vs Salvadoran 5th Grade
COMPARE
Immigrants from Sri Lanka
Salvadoran
5th Grade
5th Grade Comparison
Immigrants from Sri Lanka
Salvadorans
97.3%
5TH GRADE
53.8/ 100
METRIC RATING
171st/ 347
METRIC RANK
94.6%
5TH GRADE
0.0/ 100
METRIC RATING
343rd/ 347
METRIC RANK
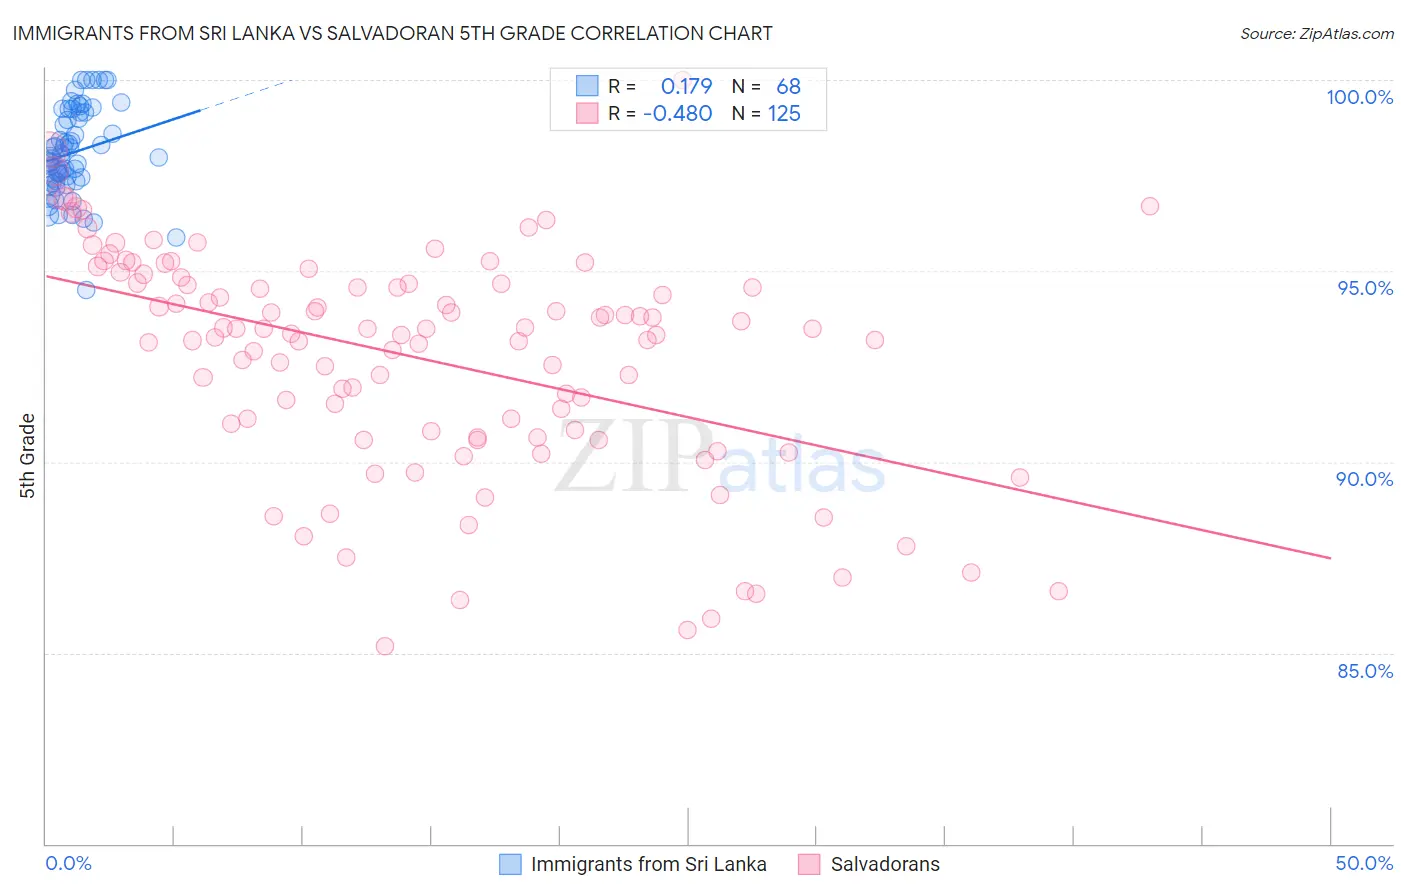
Immigrants from Sri Lanka vs Salvadoran 5th Grade Correlation Chart
The statistical analysis conducted on geographies consisting of 149,660,761 people shows a poor positive correlation between the proportion of Immigrants from Sri Lanka and percentage of population with at least 5th grade education in the United States with a correlation coefficient (R) of 0.179 and weighted average of 97.3%. Similarly, the statistical analysis conducted on geographies consisting of 399,019,564 people shows a moderate negative correlation between the proportion of Salvadorans and percentage of population with at least 5th grade education in the United States with a correlation coefficient (R) of -0.480 and weighted average of 94.6%, a difference of 2.9%.
5th Grade Correlation Summary
| Measurement | Immigrants from Sri Lanka | Salvadoran |
| Minimum | 94.5% | 85.2% |
| Maximum | 100.0% | 100.0% |
| Range | 5.5% | 14.8% |
| Mean | 98.1% | 92.7% |
| Median | 98.0% | 93.3% |
| Interquartile 25% (IQ1) | 97.4% | 90.7% |
| Interquartile 75% (IQ3) | 99.1% | 94.7% |
| Interquartile Range (IQR) | 1.8% | 4.0% |
| Standard Deviation (Sample) | 1.2% | 2.9% |
| Standard Deviation (Population) | 1.1% | 2.9% |
Similar Demographics by 5th Grade
Demographics Similar to Immigrants from Sri Lanka by 5th Grade
In terms of 5th grade, the demographic groups most similar to Immigrants from Sri Lanka are Immigrants from Belarus (97.3%, a difference of 0.0%), Chilean (97.3%, a difference of 0.0%), Immigrants from Korea (97.3%, a difference of 0.0%), Venezuelan (97.3%, a difference of 0.0%), and Arab (97.3%, a difference of 0.0%).
| Demographics | Rating | Rank | 5th Grade |
| Bermudans | 58.8 /100 | #164 | Average 97.4% |
| Immigrants | Poland | 57.9 /100 | #165 | Average 97.4% |
| Apache | 57.2 /100 | #166 | Average 97.4% |
| Immigrants | Belarus | 54.6 /100 | #167 | Average 97.3% |
| Chileans | 54.5 /100 | #168 | Average 97.3% |
| Immigrants | Korea | 54.1 /100 | #169 | Average 97.3% |
| Venezuelans | 54.0 /100 | #170 | Average 97.3% |
| Immigrants | Sri Lanka | 53.8 /100 | #171 | Average 97.3% |
| Arabs | 53.4 /100 | #172 | Average 97.3% |
| Egyptians | 52.4 /100 | #173 | Average 97.3% |
| Immigrants | Kazakhstan | 50.0 /100 | #174 | Average 97.3% |
| Immigrants | Micronesia | 48.8 /100 | #175 | Average 97.3% |
| Immigrants | Taiwan | 48.4 /100 | #176 | Average 97.3% |
| Immigrants | Spain | 47.0 /100 | #177 | Average 97.3% |
| Comanche | 42.1 /100 | #178 | Average 97.3% |
Demographics Similar to Salvadorans by 5th Grade
In terms of 5th grade, the demographic groups most similar to Salvadorans are Immigrants from Mexico (94.6%, a difference of 0.0%), Immigrants from Guatemala (94.6%, a difference of 0.010%), Immigrants from Central America (94.7%, a difference of 0.060%), Yakama (94.8%, a difference of 0.16%), and Guatemalan (94.8%, a difference of 0.24%).
| Demographics | Rating | Rank | 5th Grade |
| Immigrants | Latin America | 0.0 /100 | #333 | Tragic 95.3% |
| Nepalese | 0.0 /100 | #334 | Tragic 95.2% |
| Mexicans | 0.0 /100 | #335 | Tragic 95.2% |
| Immigrants | Azores | 0.0 /100 | #336 | Tragic 95.1% |
| Central Americans | 0.0 /100 | #337 | Tragic 95.1% |
| Immigrants | Cabo Verde | 0.0 /100 | #338 | Tragic 94.9% |
| Immigrants | Yemen | 0.0 /100 | #339 | Tragic 94.9% |
| Guatemalans | 0.0 /100 | #340 | Tragic 94.8% |
| Yakama | 0.0 /100 | #341 | Tragic 94.8% |
| Immigrants | Central America | 0.0 /100 | #342 | Tragic 94.7% |
| Salvadorans | 0.0 /100 | #343 | Tragic 94.6% |
| Immigrants | Mexico | 0.0 /100 | #344 | Tragic 94.6% |
| Immigrants | Guatemala | 0.0 /100 | #345 | Tragic 94.6% |
| Immigrants | El Salvador | 0.0 /100 | #346 | Tragic 94.3% |
| Spanish American Indians | 0.0 /100 | #347 | Tragic 94.2% |