Immigrants from Sri Lanka vs Immigrants from Liberia Bachelor's Degree
COMPARE
Immigrants from Sri Lanka
Immigrants from Liberia
Bachelor's Degree
Bachelor's Degree Comparison
Immigrants from Sri Lanka
Immigrants from Liberia
46.1%
BACHELOR'S DEGREE
100.0/ 100
METRIC RATING
30th/ 347
METRIC RANK
33.5%
BACHELOR'S DEGREE
0.9/ 100
METRIC RATING
249th/ 347
METRIC RANK
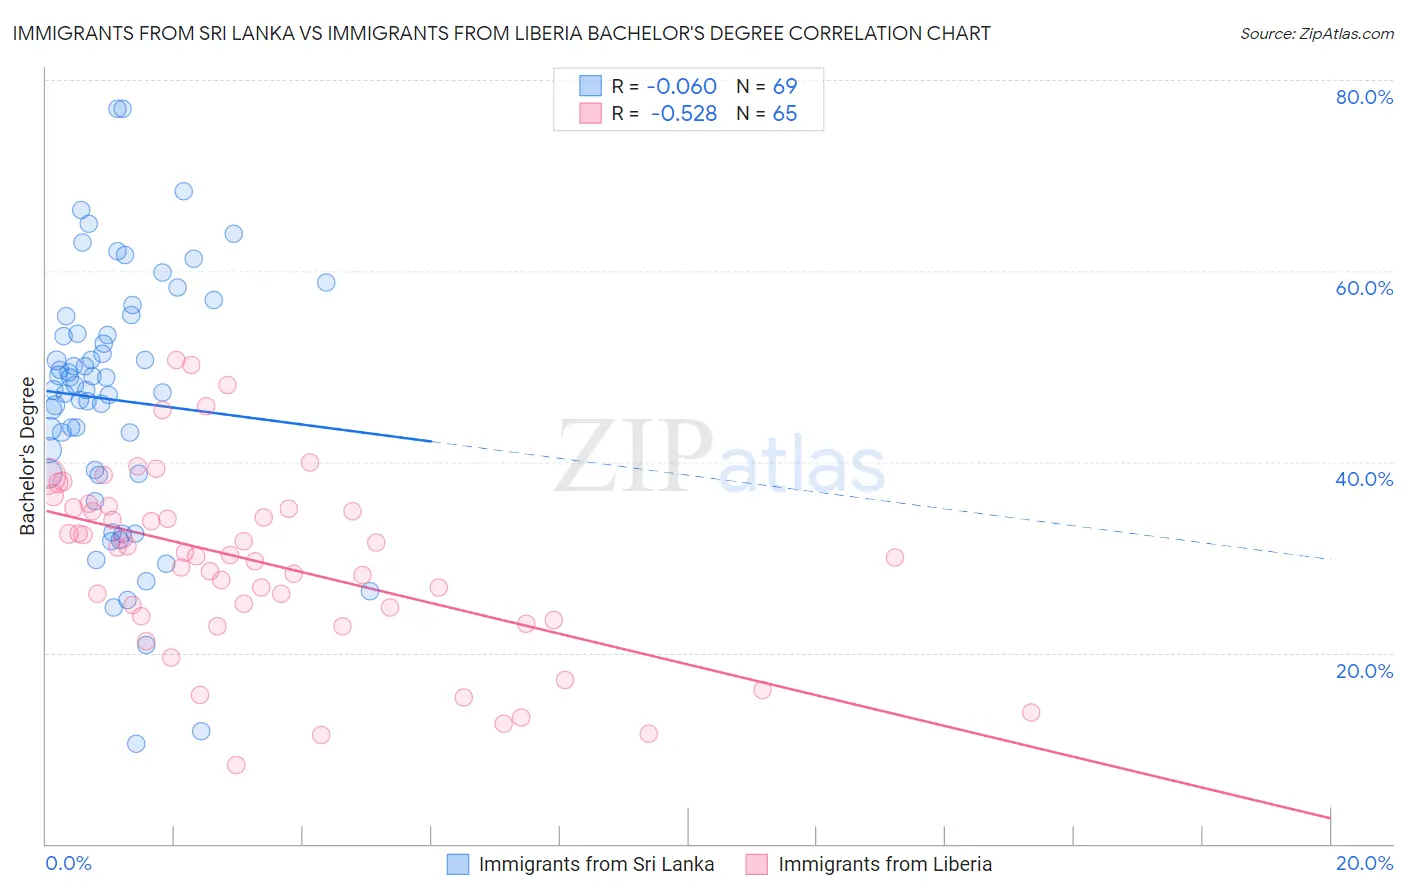
Immigrants from Sri Lanka vs Immigrants from Liberia Bachelor's Degree Correlation Chart
The statistical analysis conducted on geographies consisting of 149,698,574 people shows a slight negative correlation between the proportion of Immigrants from Sri Lanka and percentage of population with at least bachelor's degree education in the United States with a correlation coefficient (R) of -0.060 and weighted average of 46.1%. Similarly, the statistical analysis conducted on geographies consisting of 135,292,805 people shows a substantial negative correlation between the proportion of Immigrants from Liberia and percentage of population with at least bachelor's degree education in the United States with a correlation coefficient (R) of -0.528 and weighted average of 33.5%, a difference of 37.5%.
Bachelor's Degree Correlation Summary
| Measurement | Immigrants from Sri Lanka | Immigrants from Liberia |
| Minimum | 10.5% | 8.2% |
| Maximum | 77.0% | 50.7% |
| Range | 66.5% | 42.4% |
| Mean | 46.5% | 29.4% |
| Median | 47.6% | 30.3% |
| Interquartile 25% (IQ1) | 38.7% | 23.6% |
| Interquartile 75% (IQ3) | 54.4% | 35.1% |
| Interquartile Range (IQR) | 15.6% | 11.5% |
| Standard Deviation (Sample) | 13.5% | 9.5% |
| Standard Deviation (Population) | 13.4% | 9.5% |
Similar Demographics by Bachelor's Degree
Demographics Similar to Immigrants from Sri Lanka by Bachelor's Degree
In terms of bachelor's degree, the demographic groups most similar to Immigrants from Sri Lanka are Latvian (46.1%, a difference of 0.040%), Israeli (46.1%, a difference of 0.050%), Turkish (46.2%, a difference of 0.18%), Immigrants from Turkey (46.0%, a difference of 0.34%), and Immigrants from France (46.4%, a difference of 0.64%).
| Demographics | Rating | Rank | Bachelor's Degree |
| Immigrants | Sweden | 100.0 /100 | #23 | Exceptional 47.0% |
| Immigrants | Korea | 100.0 /100 | #24 | Exceptional 47.0% |
| Burmese | 100.0 /100 | #25 | Exceptional 46.9% |
| Immigrants | Japan | 100.0 /100 | #26 | Exceptional 46.8% |
| Immigrants | France | 100.0 /100 | #27 | Exceptional 46.4% |
| Turks | 100.0 /100 | #28 | Exceptional 46.2% |
| Israelis | 100.0 /100 | #29 | Exceptional 46.1% |
| Immigrants | Sri Lanka | 100.0 /100 | #30 | Exceptional 46.1% |
| Latvians | 100.0 /100 | #31 | Exceptional 46.1% |
| Immigrants | Turkey | 100.0 /100 | #32 | Exceptional 46.0% |
| Immigrants | Northern Europe | 100.0 /100 | #33 | Exceptional 45.6% |
| Immigrants | Denmark | 100.0 /100 | #34 | Exceptional 45.4% |
| Immigrants | Russia | 100.0 /100 | #35 | Exceptional 45.4% |
| Mongolians | 100.0 /100 | #36 | Exceptional 45.4% |
| Russians | 100.0 /100 | #37 | Exceptional 45.3% |
Demographics Similar to Immigrants from Liberia by Bachelor's Degree
In terms of bachelor's degree, the demographic groups most similar to Immigrants from Liberia are Indonesian (33.5%, a difference of 0.010%), Cree (33.6%, a difference of 0.13%), Immigrants from Congo (33.6%, a difference of 0.14%), Jamaican (33.6%, a difference of 0.23%), and Immigrants from Fiji (33.7%, a difference of 0.59%).
| Demographics | Rating | Rank | Bachelor's Degree |
| Immigrants | Nonimmigrants | 1.8 /100 | #242 | Tragic 34.2% |
| Immigrants | Guyana | 1.4 /100 | #243 | Tragic 33.9% |
| Delaware | 1.2 /100 | #244 | Tragic 33.8% |
| Immigrants | Fiji | 1.2 /100 | #245 | Tragic 33.7% |
| Jamaicans | 1.0 /100 | #246 | Tragic 33.6% |
| Immigrants | Congo | 1.0 /100 | #247 | Tragic 33.6% |
| Cree | 1.0 /100 | #248 | Tragic 33.6% |
| Immigrants | Liberia | 0.9 /100 | #249 | Tragic 33.5% |
| Indonesians | 0.9 /100 | #250 | Tragic 33.5% |
| Japanese | 0.7 /100 | #251 | Tragic 33.3% |
| Immigrants | Bahamas | 0.7 /100 | #252 | Tragic 33.3% |
| U.S. Virgin Islanders | 0.7 /100 | #253 | Tragic 33.2% |
| Native Hawaiians | 0.7 /100 | #254 | Tragic 33.2% |
| Iroquois | 0.7 /100 | #255 | Tragic 33.2% |
| Nicaraguans | 0.6 /100 | #256 | Tragic 33.1% |