Immigrants from Spain vs Immigrants from Ukraine 9th Grade
COMPARE
Immigrants from Spain
Immigrants from Ukraine
9th Grade
9th Grade Comparison
Immigrants from Spain
Immigrants from Ukraine
94.9%
9TH GRADE
49.1/ 100
METRIC RATING
176th/ 347
METRIC RANK
95.0%
9TH GRADE
67.4/ 100
METRIC RATING
159th/ 347
METRIC RANK
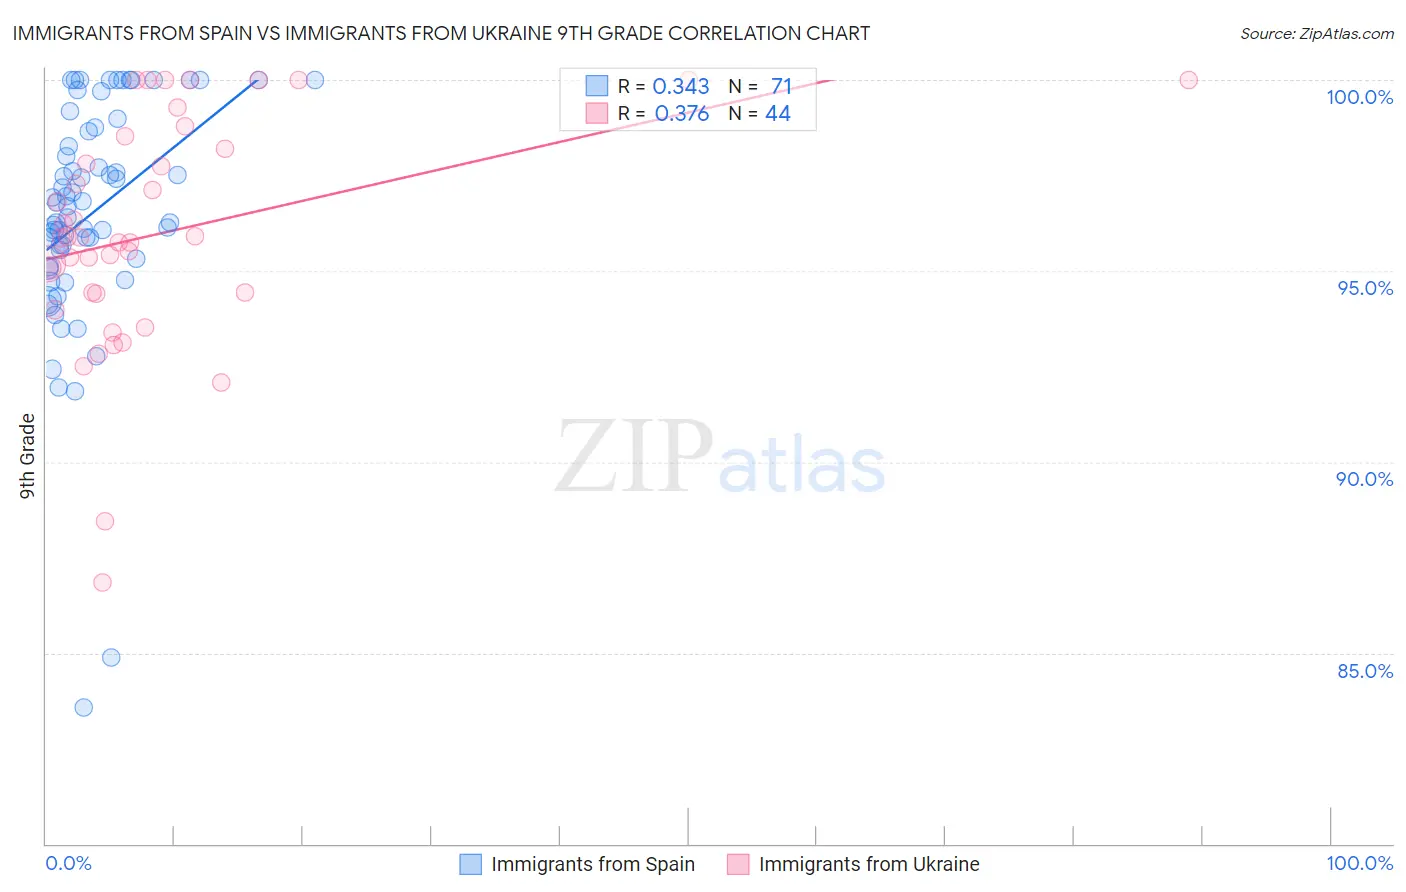
Immigrants from Spain vs Immigrants from Ukraine 9th Grade Correlation Chart
The statistical analysis conducted on geographies consisting of 239,621,997 people shows a mild positive correlation between the proportion of Immigrants from Spain and percentage of population with at least 9th grade education in the United States with a correlation coefficient (R) of 0.343 and weighted average of 94.9%. Similarly, the statistical analysis conducted on geographies consisting of 289,712,791 people shows a mild positive correlation between the proportion of Immigrants from Ukraine and percentage of population with at least 9th grade education in the United States with a correlation coefficient (R) of 0.376 and weighted average of 95.0%, a difference of 0.14%.
9th Grade Correlation Summary
| Measurement | Immigrants from Spain | Immigrants from Ukraine |
| Minimum | 83.6% | 86.8% |
| Maximum | 100.0% | 100.0% |
| Range | 16.4% | 13.2% |
| Mean | 96.5% | 96.0% |
| Median | 96.7% | 95.9% |
| Interquartile 25% (IQ1) | 95.3% | 94.4% |
| Interquartile 75% (IQ3) | 98.8% | 98.4% |
| Interquartile Range (IQR) | 3.4% | 4.0% |
| Standard Deviation (Sample) | 3.1% | 3.0% |
| Standard Deviation (Population) | 3.0% | 3.0% |
Demographics Similar to Immigrants from Spain and Immigrants from Ukraine by 9th Grade
In terms of 9th grade, the demographic groups most similar to Immigrants from Spain are Immigrants from Egypt (94.9%, a difference of 0.010%), Brazilian (94.9%, a difference of 0.010%), Immigrants from Iraq (94.9%, a difference of 0.010%), Cheyenne (94.9%, a difference of 0.020%), and Iraqi (94.9%, a difference of 0.040%). Similarly, the demographic groups most similar to Immigrants from Ukraine are Immigrants from Italy (95.0%, a difference of 0.010%), French American Indian (95.0%, a difference of 0.010%), Bermudan (95.0%, a difference of 0.010%), Egyptian (95.0%, a difference of 0.020%), and Pakistani (95.0%, a difference of 0.030%).
| Demographics | Rating | Rank | 9th Grade |
| Mongolians | 73.0 /100 | #157 | Good 95.0% |
| Egyptians | 70.1 /100 | #158 | Good 95.0% |
| Immigrants | Ukraine | 67.4 /100 | #159 | Good 95.0% |
| Immigrants | Italy | 66.6 /100 | #160 | Good 95.0% |
| French American Indians | 66.5 /100 | #161 | Good 95.0% |
| Bermudans | 65.8 /100 | #162 | Good 95.0% |
| Pakistanis | 64.1 /100 | #163 | Good 95.0% |
| Venezuelans | 63.6 /100 | #164 | Good 95.0% |
| Blackfeet | 62.6 /100 | #165 | Good 95.0% |
| Ute | 62.6 /100 | #166 | Good 95.0% |
| Immigrants | Brazil | 61.1 /100 | #167 | Good 95.0% |
| Chileans | 60.7 /100 | #168 | Good 95.0% |
| Spaniards | 59.6 /100 | #169 | Average 94.9% |
| Alsatians | 58.6 /100 | #170 | Average 94.9% |
| Colville | 58.5 /100 | #171 | Average 94.9% |
| Iraqis | 54.0 /100 | #172 | Average 94.9% |
| Cheyenne | 51.5 /100 | #173 | Average 94.9% |
| Immigrants | Egypt | 50.0 /100 | #174 | Average 94.9% |
| Brazilians | 49.8 /100 | #175 | Average 94.9% |
| Immigrants | Spain | 49.1 /100 | #176 | Average 94.9% |
| Immigrants | Iraq | 47.8 /100 | #177 | Average 94.9% |