Immigrants from Morocco vs Hopi 9th Grade
COMPARE
Immigrants from Morocco
Hopi
9th Grade
9th Grade Comparison
Immigrants from Morocco
Hopi
94.6%
9TH GRADE
16.3/ 100
METRIC RATING
207th/ 347
METRIC RANK
94.8%
9TH GRADE
37.1/ 100
METRIC RATING
186th/ 347
METRIC RANK
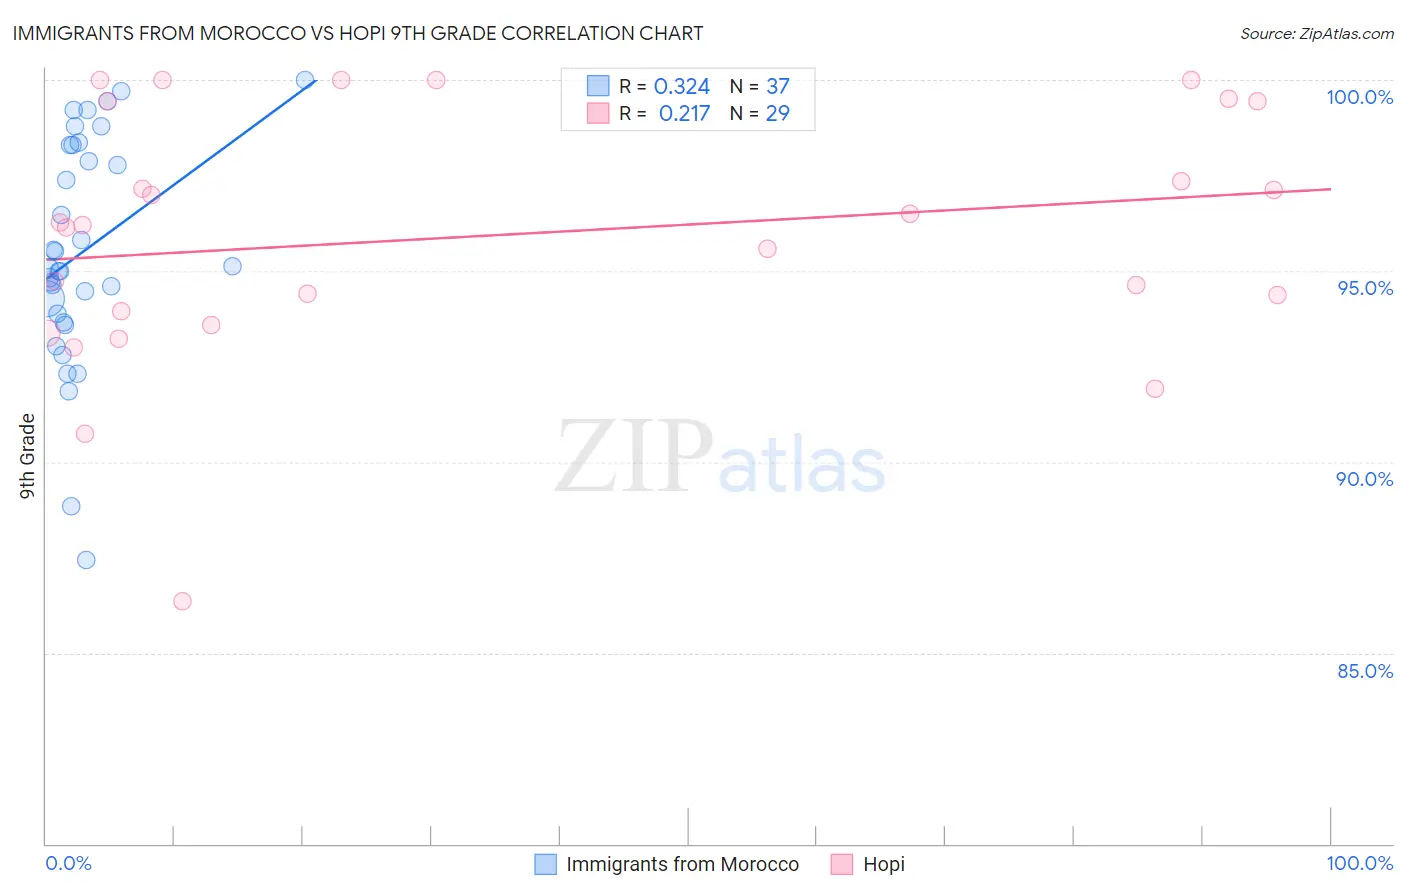
Immigrants from Morocco vs Hopi 9th Grade Correlation Chart
The statistical analysis conducted on geographies consisting of 178,912,438 people shows a mild positive correlation between the proportion of Immigrants from Morocco and percentage of population with at least 9th grade education in the United States with a correlation coefficient (R) of 0.324 and weighted average of 94.6%. Similarly, the statistical analysis conducted on geographies consisting of 74,739,957 people shows a weak positive correlation between the proportion of Hopi and percentage of population with at least 9th grade education in the United States with a correlation coefficient (R) of 0.217 and weighted average of 94.8%, a difference of 0.20%.
9th Grade Correlation Summary
| Measurement | Immigrants from Morocco | Hopi |
| Minimum | 87.4% | 86.4% |
| Maximum | 100.0% | 100.0% |
| Range | 12.6% | 13.6% |
| Mean | 95.5% | 95.9% |
| Median | 95.1% | 96.2% |
| Interquartile 25% (IQ1) | 93.8% | 93.8% |
| Interquartile 75% (IQ3) | 98.3% | 99.4% |
| Interquartile Range (IQR) | 4.5% | 5.7% |
| Standard Deviation (Sample) | 3.0% | 3.3% |
| Standard Deviation (Population) | 2.9% | 3.2% |
Similar Demographics by 9th Grade
Demographics Similar to Immigrants from Morocco by 9th Grade
In terms of 9th grade, the demographic groups most similar to Immigrants from Morocco are Samoan (94.6%, a difference of 0.010%), Immigrants from Pakistan (94.6%, a difference of 0.010%), Immigrants from Sudan (94.6%, a difference of 0.020%), Comanche (94.6%, a difference of 0.020%), and Immigrants from Eastern Asia (94.6%, a difference of 0.040%).
| Demographics | Rating | Rank | 9th Grade |
| Immigrants | Zaire | 20.6 /100 | #200 | Fair 94.6% |
| Blacks/African Americans | 20.5 /100 | #201 | Fair 94.6% |
| Immigrants | Eastern Asia | 19.8 /100 | #202 | Poor 94.6% |
| Immigrants | Bahamas | 19.8 /100 | #203 | Poor 94.6% |
| Moroccans | 19.6 /100 | #204 | Poor 94.6% |
| Immigrants | Sudan | 17.6 /100 | #205 | Poor 94.6% |
| Samoans | 17.3 /100 | #206 | Poor 94.6% |
| Immigrants | Morocco | 16.3 /100 | #207 | Poor 94.6% |
| Immigrants | Pakistan | 15.5 /100 | #208 | Poor 94.6% |
| Comanche | 14.9 /100 | #209 | Poor 94.6% |
| Immigrants | Chile | 13.4 /100 | #210 | Poor 94.5% |
| Immigrants | Indonesia | 12.3 /100 | #211 | Poor 94.5% |
| Immigrants | Malaysia | 12.2 /100 | #212 | Poor 94.5% |
| Immigrants | Oceania | 12.1 /100 | #213 | Poor 94.5% |
| Immigrants | Liberia | 11.8 /100 | #214 | Poor 94.5% |
Demographics Similar to Hopi by 9th Grade
In terms of 9th grade, the demographic groups most similar to Hopi are Argentinean (94.8%, a difference of 0.0%), Liberian (94.8%, a difference of 0.0%), Guamanian/Chamorro (94.8%, a difference of 0.010%), Immigrants from Nepal (94.8%, a difference of 0.020%), and Immigrants from Albania (94.8%, a difference of 0.020%).
| Demographics | Rating | Rank | 9th Grade |
| Immigrants | Venezuela | 46.5 /100 | #179 | Average 94.9% |
| Immigrants | Uganda | 43.1 /100 | #180 | Average 94.8% |
| Sierra Leoneans | 42.7 /100 | #181 | Average 94.8% |
| Seminole | 42.5 /100 | #182 | Average 94.8% |
| Immigrants | Nepal | 39.7 /100 | #183 | Fair 94.8% |
| Argentineans | 37.6 /100 | #184 | Fair 94.8% |
| Liberians | 37.4 /100 | #185 | Fair 94.8% |
| Hopi | 37.1 /100 | #186 | Fair 94.8% |
| Guamanians/Chamorros | 35.5 /100 | #187 | Fair 94.8% |
| Immigrants | Albania | 34.5 /100 | #188 | Fair 94.8% |
| Immigrants | Argentina | 34.4 /100 | #189 | Fair 94.8% |
| Sudanese | 32.7 /100 | #190 | Fair 94.7% |
| Assyrians/Chaldeans/Syriacs | 32.0 /100 | #191 | Fair 94.7% |
| Immigrants | Northern Africa | 30.7 /100 | #192 | Fair 94.7% |
| Paraguayans | 30.1 /100 | #193 | Fair 94.7% |