Immigrants from Spain vs Costa Rican 4th Grade
COMPARE
Immigrants from Spain
Costa Rican
4th Grade
4th Grade Comparison
Immigrants from Spain
Costa Ricans
97.5%
4TH GRADE
51.8/ 100
METRIC RATING
170th/ 347
METRIC RANK
97.3%
4TH GRADE
8.3/ 100
METRIC RATING
213th/ 347
METRIC RANK
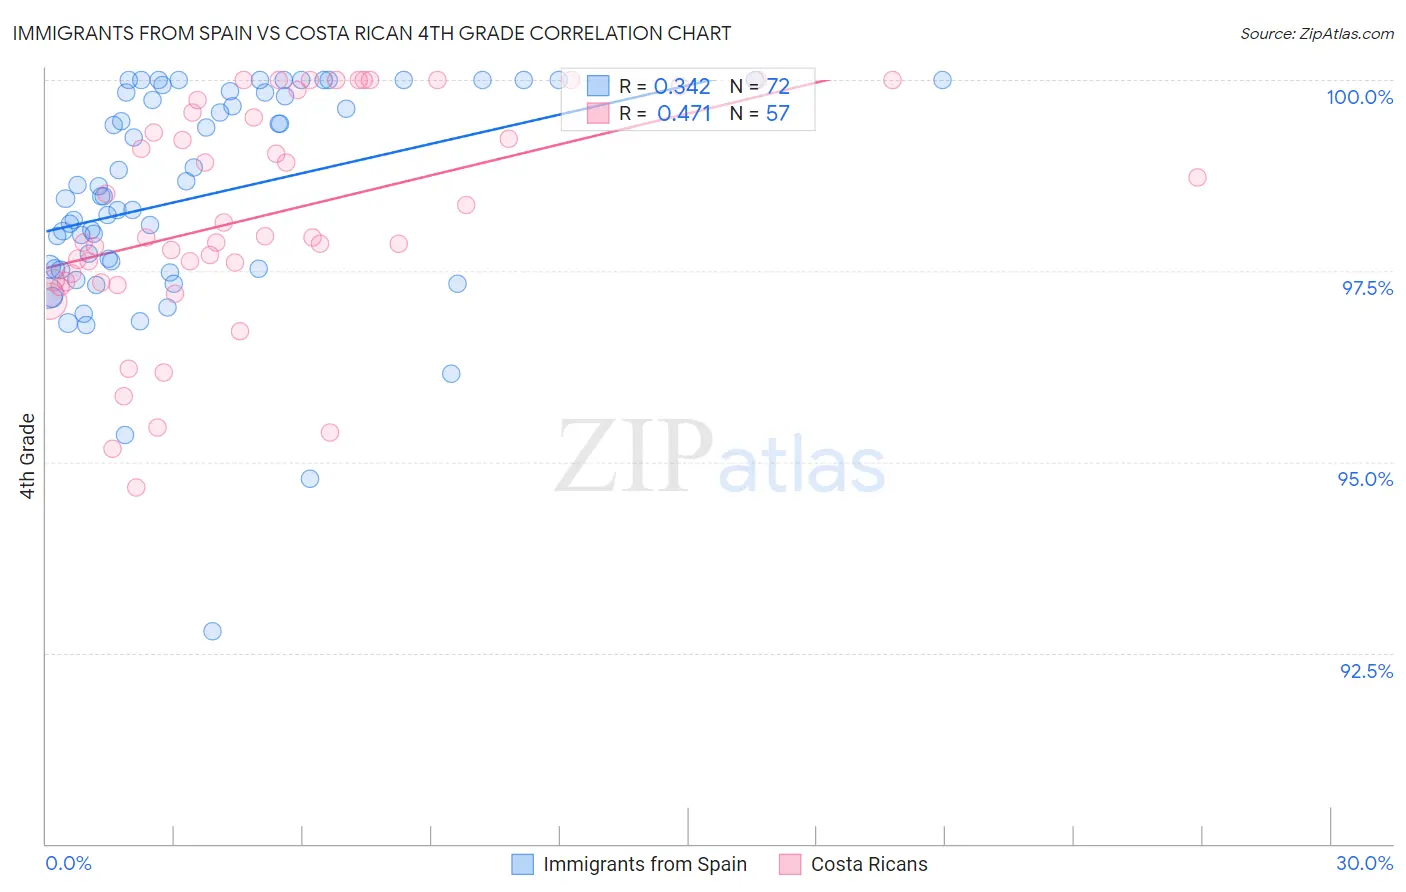
Immigrants from Spain vs Costa Rican 4th Grade Correlation Chart
The statistical analysis conducted on geographies consisting of 239,682,725 people shows a mild positive correlation between the proportion of Immigrants from Spain and percentage of population with at least 4th grade education in the United States with a correlation coefficient (R) of 0.342 and weighted average of 97.5%. Similarly, the statistical analysis conducted on geographies consisting of 253,599,979 people shows a moderate positive correlation between the proportion of Costa Ricans and percentage of population with at least 4th grade education in the United States with a correlation coefficient (R) of 0.471 and weighted average of 97.3%, a difference of 0.23%.
4th Grade Correlation Summary
| Measurement | Immigrants from Spain | Costa Rican |
| Minimum | 92.8% | 94.7% |
| Maximum | 100.0% | 100.0% |
| Range | 7.2% | 5.3% |
| Mean | 98.5% | 98.2% |
| Median | 98.5% | 97.9% |
| Interquartile 25% (IQ1) | 97.5% | 97.4% |
| Interquartile 75% (IQ3) | 99.8% | 99.7% |
| Interquartile Range (IQR) | 2.3% | 2.3% |
| Standard Deviation (Sample) | 1.4% | 1.4% |
| Standard Deviation (Population) | 1.4% | 1.4% |
Similar Demographics by 4th Grade
Demographics Similar to Immigrants from Spain by 4th Grade
In terms of 4th grade, the demographic groups most similar to Immigrants from Spain are Brazilian (97.5%, a difference of 0.0%), Immigrants from Sri Lanka (97.5%, a difference of 0.0%), Immigrants from Korea (97.5%, a difference of 0.0%), Chilean (97.5%, a difference of 0.010%), and Egyptian (97.5%, a difference of 0.010%).
| Demographics | Rating | Rank | 4th Grade |
| Immigrants | Iran | 60.3 /100 | #163 | Good 97.6% |
| Ugandans | 58.9 /100 | #164 | Average 97.6% |
| Venezuelans | 58.7 /100 | #165 | Average 97.6% |
| Kenyans | 56.5 /100 | #166 | Average 97.5% |
| Immigrants | Poland | 55.9 /100 | #167 | Average 97.5% |
| Immigrants | Belarus | 55.8 /100 | #168 | Average 97.5% |
| Chileans | 54.4 /100 | #169 | Average 97.5% |
| Immigrants | Spain | 51.8 /100 | #170 | Average 97.5% |
| Brazilians | 51.5 /100 | #171 | Average 97.5% |
| Immigrants | Sri Lanka | 51.1 /100 | #172 | Average 97.5% |
| Immigrants | Korea | 50.6 /100 | #173 | Average 97.5% |
| Egyptians | 50.0 /100 | #174 | Average 97.5% |
| Immigrants | Micronesia | 49.6 /100 | #175 | Average 97.5% |
| Arabs | 48.7 /100 | #176 | Average 97.5% |
| Immigrants | Brazil | 46.1 /100 | #177 | Average 97.5% |
Demographics Similar to Costa Ricans by 4th Grade
In terms of 4th grade, the demographic groups most similar to Costa Ricans are Tohono O'odham (97.3%, a difference of 0.0%), Laotian (97.3%, a difference of 0.010%), Immigrants from Oceania (97.3%, a difference of 0.010%), Sudanese (97.3%, a difference of 0.010%), and Immigrants from Nepal (97.3%, a difference of 0.010%).
| Demographics | Rating | Rank | 4th Grade |
| Immigrants | Zaire | 12.8 /100 | #206 | Poor 97.3% |
| Moroccans | 11.3 /100 | #207 | Poor 97.3% |
| Immigrants | Bahamas | 10.8 /100 | #208 | Poor 97.3% |
| Laotians | 9.3 /100 | #209 | Tragic 97.3% |
| Immigrants | Oceania | 9.1 /100 | #210 | Tragic 97.3% |
| Sudanese | 9.0 /100 | #211 | Tragic 97.3% |
| Tohono O'odham | 8.4 /100 | #212 | Tragic 97.3% |
| Costa Ricans | 8.3 /100 | #213 | Tragic 97.3% |
| Immigrants | Nepal | 7.7 /100 | #214 | Tragic 97.3% |
| Immigrants | Morocco | 7.1 /100 | #215 | Tragic 97.3% |
| Samoans | 6.8 /100 | #216 | Tragic 97.3% |
| Sierra Leoneans | 6.5 /100 | #217 | Tragic 97.3% |
| Iraqis | 6.3 /100 | #218 | Tragic 97.3% |
| Tongans | 5.8 /100 | #219 | Tragic 97.3% |
| South American Indians | 5.5 /100 | #220 | Tragic 97.3% |