Immigrants from Spain vs Immigrants from India 4th Grade
COMPARE
Immigrants from Spain
Immigrants from India
4th Grade
4th Grade Comparison
Immigrants from Spain
Immigrants from India
97.5%
4TH GRADE
51.8/ 100
METRIC RATING
170th/ 347
METRIC RANK
98.0%
4TH GRADE
99.1/ 100
METRIC RATING
81st/ 347
METRIC RANK
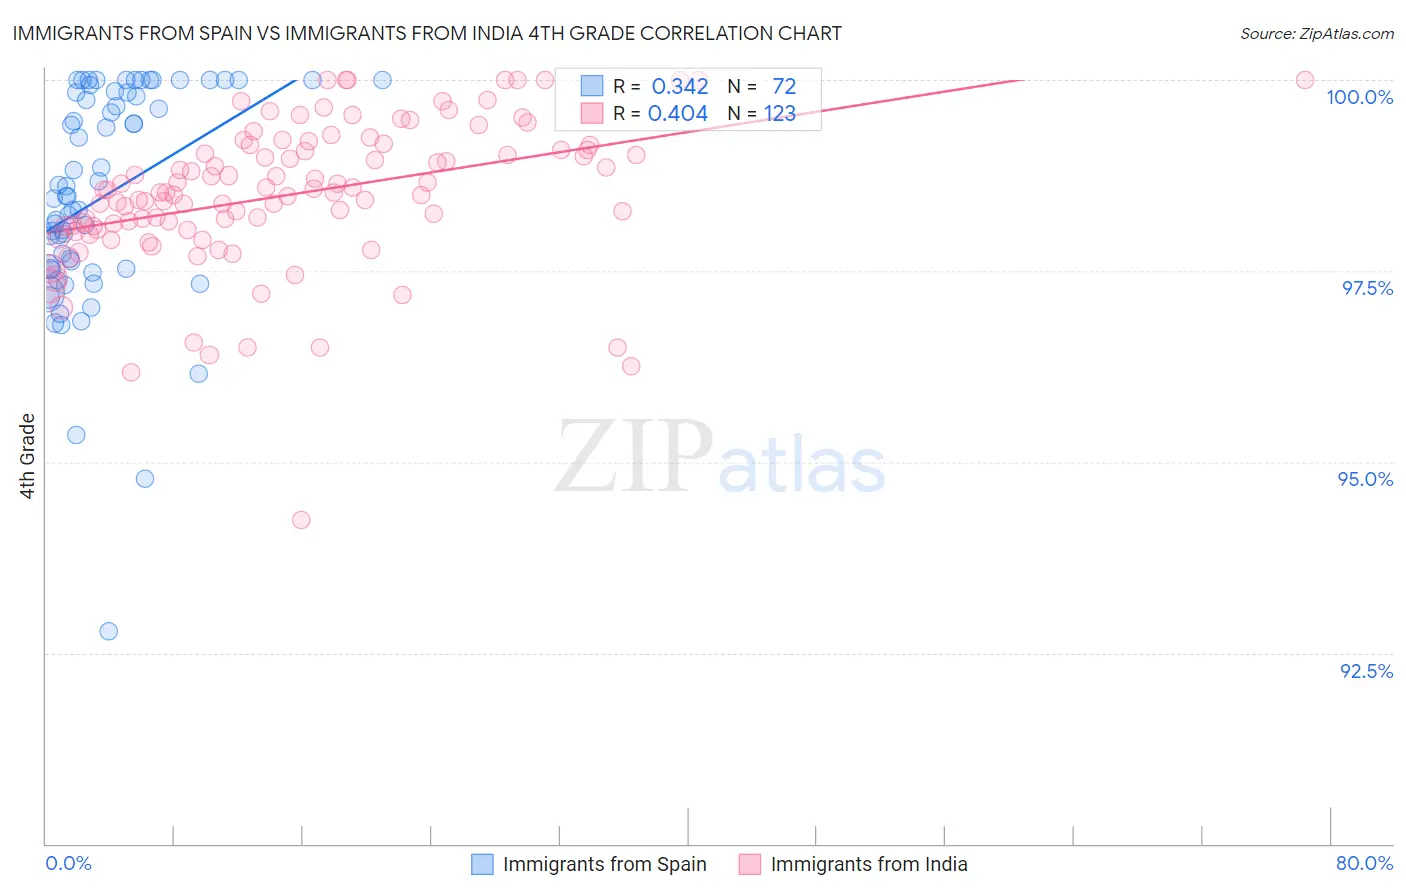
Immigrants from Spain vs Immigrants from India 4th Grade Correlation Chart
The statistical analysis conducted on geographies consisting of 239,682,725 people shows a mild positive correlation between the proportion of Immigrants from Spain and percentage of population with at least 4th grade education in the United States with a correlation coefficient (R) of 0.342 and weighted average of 97.5%. Similarly, the statistical analysis conducted on geographies consisting of 434,105,844 people shows a moderate positive correlation between the proportion of Immigrants from India and percentage of population with at least 4th grade education in the United States with a correlation coefficient (R) of 0.404 and weighted average of 98.0%, a difference of 0.44%.
4th Grade Correlation Summary
| Measurement | Immigrants from Spain | Immigrants from India |
| Minimum | 92.8% | 94.2% |
| Maximum | 100.0% | 100.0% |
| Range | 7.2% | 5.8% |
| Mean | 98.5% | 98.5% |
| Median | 98.5% | 98.5% |
| Interquartile 25% (IQ1) | 97.5% | 98.1% |
| Interquartile 75% (IQ3) | 99.8% | 99.2% |
| Interquartile Range (IQR) | 2.3% | 1.1% |
| Standard Deviation (Sample) | 1.4% | 0.96% |
| Standard Deviation (Population) | 1.4% | 0.95% |
Similar Demographics by 4th Grade
Demographics Similar to Immigrants from Spain by 4th Grade
In terms of 4th grade, the demographic groups most similar to Immigrants from Spain are Brazilian (97.5%, a difference of 0.0%), Immigrants from Sri Lanka (97.5%, a difference of 0.0%), Immigrants from Korea (97.5%, a difference of 0.0%), Chilean (97.5%, a difference of 0.010%), and Egyptian (97.5%, a difference of 0.010%).
| Demographics | Rating | Rank | 4th Grade |
| Immigrants | Iran | 60.3 /100 | #163 | Good 97.6% |
| Ugandans | 58.9 /100 | #164 | Average 97.6% |
| Venezuelans | 58.7 /100 | #165 | Average 97.6% |
| Kenyans | 56.5 /100 | #166 | Average 97.5% |
| Immigrants | Poland | 55.9 /100 | #167 | Average 97.5% |
| Immigrants | Belarus | 55.8 /100 | #168 | Average 97.5% |
| Chileans | 54.4 /100 | #169 | Average 97.5% |
| Immigrants | Spain | 51.8 /100 | #170 | Average 97.5% |
| Brazilians | 51.5 /100 | #171 | Average 97.5% |
| Immigrants | Sri Lanka | 51.1 /100 | #172 | Average 97.5% |
| Immigrants | Korea | 50.6 /100 | #173 | Average 97.5% |
| Egyptians | 50.0 /100 | #174 | Average 97.5% |
| Immigrants | Micronesia | 49.6 /100 | #175 | Average 97.5% |
| Arabs | 48.7 /100 | #176 | Average 97.5% |
| Immigrants | Brazil | 46.1 /100 | #177 | Average 97.5% |
Demographics Similar to Immigrants from India by 4th Grade
In terms of 4th grade, the demographic groups most similar to Immigrants from India are Icelander (98.0%, a difference of 0.0%), Ukrainian (98.0%, a difference of 0.010%), Osage (98.0%, a difference of 0.010%), Immigrants from Netherlands (98.0%, a difference of 0.020%), and Cherokee (98.0%, a difference of 0.020%).
| Demographics | Rating | Rank | 4th Grade |
| Chickasaw | 99.4 /100 | #74 | Exceptional 98.0% |
| Immigrants | Netherlands | 99.3 /100 | #75 | Exceptional 98.0% |
| Cherokee | 99.3 /100 | #76 | Exceptional 98.0% |
| Immigrants | Lithuania | 99.3 /100 | #77 | Exceptional 98.0% |
| Immigrants | England | 99.3 /100 | #78 | Exceptional 98.0% |
| Ukrainians | 99.2 /100 | #79 | Exceptional 98.0% |
| Osage | 99.2 /100 | #80 | Exceptional 98.0% |
| Immigrants | India | 99.1 /100 | #81 | Exceptional 98.0% |
| Icelanders | 99.1 /100 | #82 | Exceptional 98.0% |
| Immigrants | Belgium | 99.0 /100 | #83 | Exceptional 97.9% |
| Cypriots | 98.9 /100 | #84 | Exceptional 97.9% |
| Potawatomi | 98.9 /100 | #85 | Exceptional 97.9% |
| Immigrants | Australia | 98.8 /100 | #86 | Exceptional 97.9% |
| Zimbabweans | 98.8 /100 | #87 | Exceptional 97.9% |
| Immigrants | South Africa | 98.8 /100 | #88 | Exceptional 97.9% |