Immigrants from Laos vs Costa Rican 4th Grade
COMPARE
Immigrants from Laos
Costa Rican
4th Grade
4th Grade Comparison
Immigrants from Laos
Costa Ricans
96.3%
4TH GRADE
0.0/ 100
METRIC RATING
308th/ 347
METRIC RANK
97.3%
4TH GRADE
8.3/ 100
METRIC RATING
213th/ 347
METRIC RANK
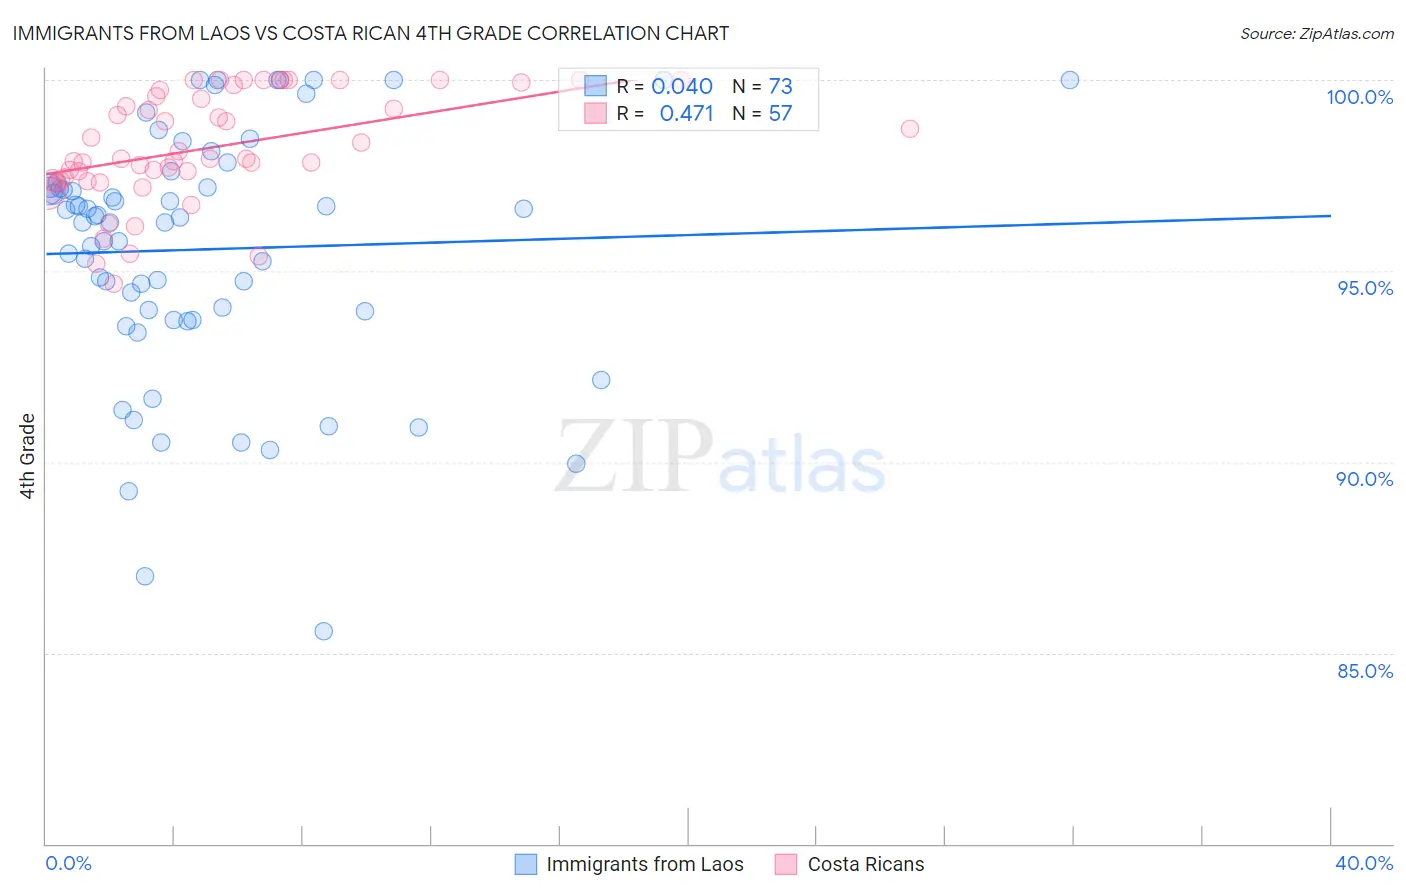
Immigrants from Laos vs Costa Rican 4th Grade Correlation Chart
The statistical analysis conducted on geographies consisting of 201,453,273 people shows no correlation between the proportion of Immigrants from Laos and percentage of population with at least 4th grade education in the United States with a correlation coefficient (R) of 0.040 and weighted average of 96.3%. Similarly, the statistical analysis conducted on geographies consisting of 253,599,979 people shows a moderate positive correlation between the proportion of Costa Ricans and percentage of population with at least 4th grade education in the United States with a correlation coefficient (R) of 0.471 and weighted average of 97.3%, a difference of 1.0%.
4th Grade Correlation Summary
| Measurement | Immigrants from Laos | Costa Rican |
| Minimum | 85.6% | 94.7% |
| Maximum | 100.0% | 100.0% |
| Range | 14.4% | 5.3% |
| Mean | 95.6% | 98.2% |
| Median | 96.4% | 97.9% |
| Interquartile 25% (IQ1) | 93.8% | 97.4% |
| Interquartile 75% (IQ3) | 97.2% | 99.7% |
| Interquartile Range (IQR) | 3.4% | 2.3% |
| Standard Deviation (Sample) | 3.2% | 1.4% |
| Standard Deviation (Population) | 3.2% | 1.4% |
Similar Demographics by 4th Grade
Demographics Similar to Immigrants from Laos by 4th Grade
In terms of 4th grade, the demographic groups most similar to Immigrants from Laos are Immigrants from Guyana (96.3%, a difference of 0.0%), Immigrants from Haiti (96.3%, a difference of 0.010%), Sri Lankan (96.4%, a difference of 0.030%), Immigrants from Burma/Myanmar (96.3%, a difference of 0.030%), and Immigrants from Caribbean (96.4%, a difference of 0.050%).
| Demographics | Rating | Rank | 4th Grade |
| Immigrants | Immigrants | 0.0 /100 | #301 | Tragic 96.5% |
| Immigrants | Cuba | 0.0 /100 | #302 | Tragic 96.4% |
| Guyanese | 0.0 /100 | #303 | Tragic 96.4% |
| Ecuadorians | 0.0 /100 | #304 | Tragic 96.4% |
| Immigrants | Caribbean | 0.0 /100 | #305 | Tragic 96.4% |
| Sri Lankans | 0.0 /100 | #306 | Tragic 96.4% |
| Immigrants | Haiti | 0.0 /100 | #307 | Tragic 96.3% |
| Immigrants | Laos | 0.0 /100 | #308 | Tragic 96.3% |
| Immigrants | Guyana | 0.0 /100 | #309 | Tragic 96.3% |
| Immigrants | Burma/Myanmar | 0.0 /100 | #310 | Tragic 96.3% |
| Immigrants | Bangladesh | 0.0 /100 | #311 | Tragic 96.2% |
| Cape Verdeans | 0.0 /100 | #312 | Tragic 96.2% |
| Indonesians | 0.0 /100 | #313 | Tragic 96.2% |
| Vietnamese | 0.0 /100 | #314 | Tragic 96.2% |
| Nicaraguans | 0.0 /100 | #315 | Tragic 96.2% |
Demographics Similar to Costa Ricans by 4th Grade
In terms of 4th grade, the demographic groups most similar to Costa Ricans are Tohono O'odham (97.3%, a difference of 0.0%), Laotian (97.3%, a difference of 0.010%), Immigrants from Oceania (97.3%, a difference of 0.010%), Sudanese (97.3%, a difference of 0.010%), and Immigrants from Nepal (97.3%, a difference of 0.010%).
| Demographics | Rating | Rank | 4th Grade |
| Immigrants | Zaire | 12.8 /100 | #206 | Poor 97.3% |
| Moroccans | 11.3 /100 | #207 | Poor 97.3% |
| Immigrants | Bahamas | 10.8 /100 | #208 | Poor 97.3% |
| Laotians | 9.3 /100 | #209 | Tragic 97.3% |
| Immigrants | Oceania | 9.1 /100 | #210 | Tragic 97.3% |
| Sudanese | 9.0 /100 | #211 | Tragic 97.3% |
| Tohono O'odham | 8.4 /100 | #212 | Tragic 97.3% |
| Costa Ricans | 8.3 /100 | #213 | Tragic 97.3% |
| Immigrants | Nepal | 7.7 /100 | #214 | Tragic 97.3% |
| Immigrants | Morocco | 7.1 /100 | #215 | Tragic 97.3% |
| Samoans | 6.8 /100 | #216 | Tragic 97.3% |
| Sierra Leoneans | 6.5 /100 | #217 | Tragic 97.3% |
| Iraqis | 6.3 /100 | #218 | Tragic 97.3% |
| Tongans | 5.8 /100 | #219 | Tragic 97.3% |
| South American Indians | 5.5 /100 | #220 | Tragic 97.3% |