Immigrants from Southern Europe vs Dutch Unemployment Among Ages 55 to 59 years

COMPARE

Immigrants from Southern Europe
Race
Ancestry
AfghanAfricanAlaska NativeAlaskan AthabascanAlbanianAleutAlsatianAmericanApacheArabArapahoArgentineanArmenianAssyrian/Chaldean/SyriacAustralianAustrianBahamianBangladeshiBarbadianBasqueBelgianBelizeanBermudanBhutaneseBlackfeetBolivianBrazilianBritishBritish West IndianBulgarianBurmeseCajunCambodianCanadianCape VerdeanCarpatho RusynCelticCentral AmericanCentral American IndianCherokeeCheyenneChickasawChileanChineseChippewaChoctawColombianColvilleComancheCosta RicanCreeCreekCroatianCrowCubanCypriotCzechCzechoslovakianDanishDelawareDominicanDutch West IndianEastern EuropeanEcuadorianEgyptianEnglishEstonianEthiopianEuropeanFijianFilipinoFinnishFrenchFrench American IndianFrench CanadianGermanGerman RussianGhanaianGreekGuamanian/ChamorroGuatemalanGuyaneseHaitianHmongHonduranHopiHoumaHungarianIcelanderIndian (Asian)IndonesianInupiatIranianIraqiIrishIroquoisIsraeliItalianJamaicanJapaneseJordanianKenyanKiowaKoreanLaotianLatvianLebaneseLiberianLithuanianLumbeeLuxembourgerMacedonianMalaysianMalteseMarshalleseMenomineeMexicanMexican American IndianMongolianMoroccanNative HawaiianNavajoNepaleseNew ZealanderNicaraguanNigerianNorthern EuropeanNorwegianOkinawanOsageOttawaPaiutePakistaniPalestinianPanamanianParaguayanPennsylvania GermanPeruvianPimaPolishPortuguesePotawatomiPuebloPuerto RicanPuget Sound SalishRomanianRussianSalvadoranSamoanScandinavianScotch-IrishScottishSeminoleSenegaleseSerbianShoshoneSierra LeoneanSiouxSlavicSlovakSloveneSomaliSouth AfricanSouth AmericanSouth American IndianSoviet UnionSpaniardSpanishSpanish AmericanSpanish American IndianSri LankanSubsaharan AfricanSudaneseSwedishSwissSyrianTaiwaneseThaiTlingit-HaidaTohono O'OdhamTonganTrinidadian and TobagonianTsimshianTurkishU.S. Virgin IslanderUgandanUkrainianUruguayanUteVenezuelanVietnameseWelshWest IndianYakamaYaquiYugoslavianYumanYup'ikZimbabwean
Immigration
NonimmigrantsImmigrantsAfghanistanAfricaAlbaniaArgentinaArmeniaAsiaAustraliaAustriaBahamasBangladeshBarbadosBelarusBelgiumBelizeBoliviaBosnia and HerzegovinaBrazilBulgariaBurma/MyanmarCabo VerdeCambodiaCameroonCanadaCaribbeanCentral AmericaChileChinaColombiaCongoCosta RicaCroatiaCubaCzechoslovakiaDenmarkDominicaDominican RepublicEastern AfricaEastern AsiaEastern EuropeEcuadorEgyptEl SalvadorEnglandEritreaEthiopiaEuropeFijiFranceGermanyGhanaGreeceGrenadaGuatemalaGuyanaHaitiHondurasHong KongHungaryIndiaIndonesiaIranIraqIrelandIsraelItalyJamaicaJapanJordanKazakhstanKenyaKoreaKuwaitLaosLatin AmericaLatviaLebanonLiberiaLithuaniaMalaysiaMexicoMicronesiaMiddle AfricaMoldovaMoroccoNepalNetherlandsNicaraguaNigeriaNorth AmericaNorth MacedoniaNorthern AfricaNorthern EuropeNorwayOceaniaPakistanPanamaPeruPhilippinesPolandPortugalRomaniaRussiaSaudi ArabiaScotlandSenegalSerbiaSierra LeoneSingaporeSomaliaSouth AfricaSouth AmericaSouth Central AsiaSouth Eastern AsiaSouthern EuropeSpainSri LankaSt. Vincent and the GrenadinesSudanSwedenSwitzerlandSyriaTaiwanThailandTrinidad and TobagoTurkeyUgandaUkraineUruguayUzbekistanVenezuelaVietnamWest IndiesWestern AfricaWestern AsiaWestern EuropeYemenZaireZimbabweAzores
Dutch
Race
Ancestry
AfghanAfricanAlaska NativeAlaskan AthabascanAlbanianAleutAlsatianAmericanApacheArabArapahoArgentineanArmenianAssyrian/Chaldean/SyriacAustralianAustrianBahamianBangladeshiBarbadianBasqueBelgianBelizeanBermudanBhutaneseBlackfeetBolivianBrazilianBritishBritish West IndianBulgarianBurmeseCajunCambodianCanadianCape VerdeanCarpatho RusynCelticCentral AmericanCentral American IndianCherokeeCheyenneChickasawChileanChineseChippewaChoctawColombianColvilleComancheCosta RicanCreeCreekCroatianCrowCubanCypriotCzechCzechoslovakianDanishDelawareDominicanDutchDutch West IndianEastern EuropeanEcuadorianEgyptianEnglishEstonianEthiopianEuropeanFijianFilipinoFinnishFrenchFrench American IndianFrench CanadianGermanGerman RussianGhanaianGreekGuamanian/ChamorroGuatemalanGuyaneseHaitianHmongHonduranHopiHoumaHungarianIcelanderIndian (Asian)IndonesianInupiatIranianIraqiIrishIroquoisIsraeliItalianJamaicanJapaneseJordanianKenyanKiowaKoreanLaotianLatvianLebaneseLiberianLithuanianLumbeeLuxembourgerMacedonianMalaysianMalteseMarshalleseMenomineeMexicanMexican American IndianMongolianMoroccanNative HawaiianNavajoNepaleseNew ZealanderNicaraguanNigerianNorthern EuropeanNorwegianOkinawanOsageOttawaPaiutePakistaniPalestinianPanamanianParaguayanPennsylvania GermanPeruvianPimaPolishPortuguesePotawatomiPuebloPuerto RicanPuget Sound SalishRomanianRussianSalvadoranSamoanScandinavianScotch-IrishScottishSeminoleSenegaleseSerbianShoshoneSierra LeoneanSiouxSlavicSlovakSloveneSomaliSouth AfricanSouth AmericanSouth American IndianSoviet UnionSpaniardSpanishSpanish AmericanSpanish American IndianSri LankanSubsaharan AfricanSudaneseSwedishSwissSyrianTaiwaneseThaiTlingit-HaidaTohono O'OdhamTonganTrinidadian and TobagonianTsimshianTurkishU.S. Virgin IslanderUgandanUkrainianUruguayanUteVenezuelanVietnameseWelshWest IndianYakamaYaquiYugoslavianYumanYup'ikZimbabwean
Immigration
NonimmigrantsImmigrantsAfghanistanAfricaAlbaniaArgentinaArmeniaAsiaAustraliaAustriaBahamasBangladeshBarbadosBelarusBelgiumBelizeBoliviaBosnia and HerzegovinaBrazilBulgariaBurma/MyanmarCabo VerdeCambodiaCameroonCanadaCaribbeanCentral AmericaChileChinaColombiaCongoCosta RicaCroatiaCubaCzechoslovakiaDenmarkDominicaDominican RepublicEastern AfricaEastern AsiaEastern EuropeEcuadorEgyptEl SalvadorEnglandEritreaEthiopiaEuropeFijiFranceGermanyGhanaGreeceGrenadaGuatemalaGuyanaHaitiHondurasHong KongHungaryIndiaIndonesiaIranIraqIrelandIsraelItalyJamaicaJapanJordanKazakhstanKenyaKoreaKuwaitLaosLatin AmericaLatviaLebanonLiberiaLithuaniaMalaysiaMexicoMicronesiaMiddle AfricaMoldovaMoroccoNepalNetherlandsNicaraguaNigeriaNorth AmericaNorth MacedoniaNorthern AfricaNorthern EuropeNorwayOceaniaPakistanPanamaPeruPhilippinesPolandPortugalRomaniaRussiaSaudi ArabiaScotlandSenegalSerbiaSierra LeoneSingaporeSomaliaSouth AfricaSouth AmericaSouth Central AsiaSouth Eastern AsiaSpainSri LankaSt. Vincent and the GrenadinesSudanSwedenSwitzerlandSyriaTaiwanThailandTrinidad and TobagoTurkeyUgandaUkraineUruguayUzbekistanVenezuelaVietnamWest IndiesWestern AfricaWestern AsiaWestern EuropeYemenZaireZimbabweAzores
Unemployment Among Ages 55 to 59 years
Income
Poverty
Unemployment
Labor Participation
Family Structure
Vehicle Availability
Education Level
Disability

Unemployment Among Ages 55 to 59 years Comparison

Immigrants from Southern Europe

Dutch

Tragic
Exceptional
5.0%
UNEMPLOYMENT AMONG AGES 55 TO 59 YEARS
1.8/ 100
METRIC RATING
234th/ 347
METRIC RANK
4.6%
UNEMPLOYMENT AMONG AGES 55 TO 59 YEARS
99.5/ 100
METRIC RATING
60th/ 347
METRIC RANK

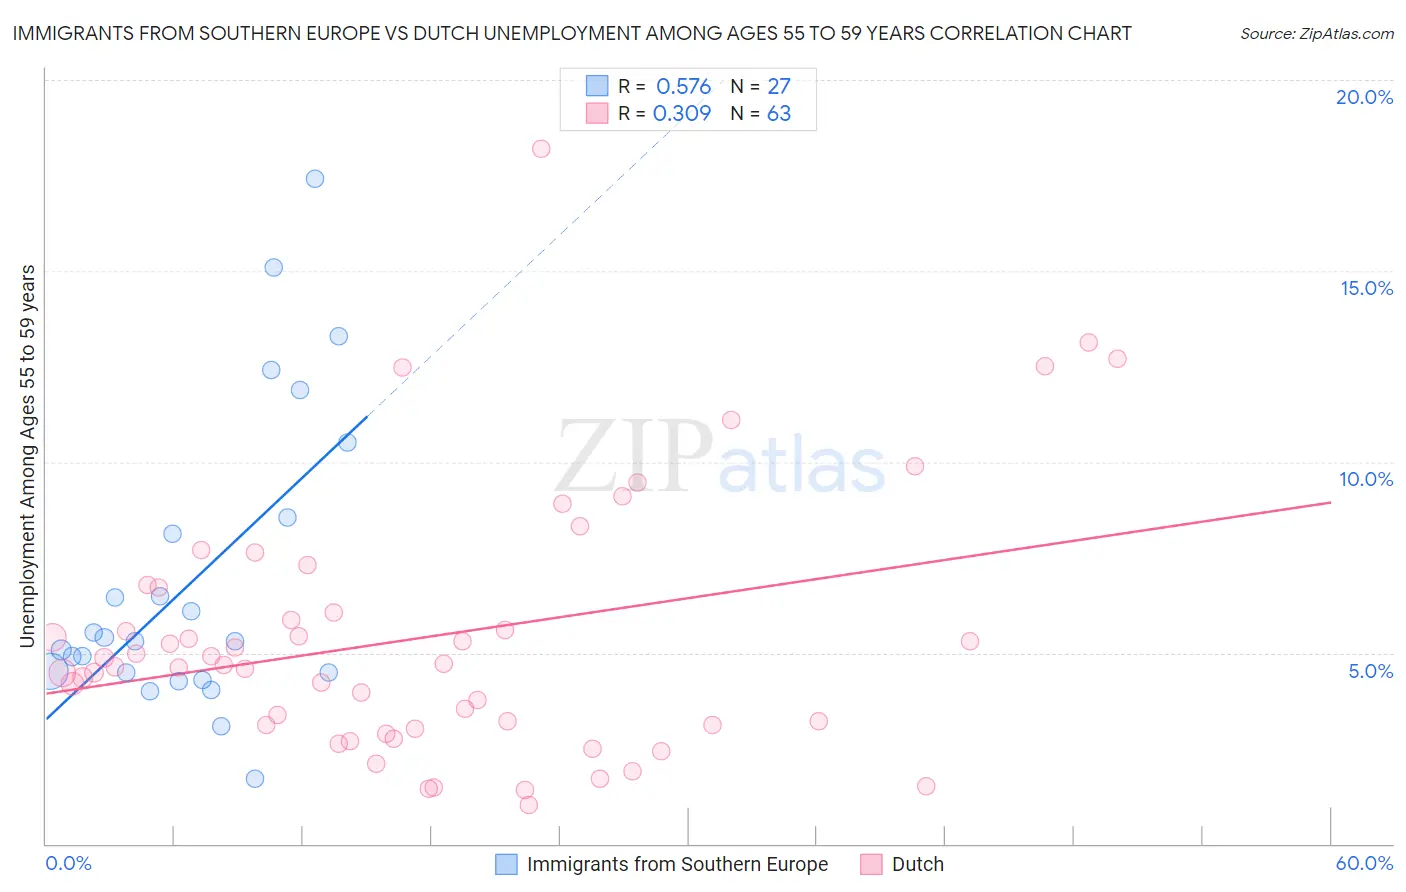
Immigrants from Southern Europe vs Dutch Unemployment Among Ages 55 to 59 years Correlation Chart

The statistical analysis conducted on geographies consisting of 375,573,900 people shows a substantial positive correlation between the proportion of Immigrants from Southern Europe and unemployment rate among population between the ages 55 and 59 in the United States with a correlation coefficient (R) of 0.576 and weighted average of 5.0%. Similarly, the statistical analysis conducted on geographies consisting of 475,957,020 people shows a mild positive correlation between the proportion of Dutch and unemployment rate among population between the ages 55 and 59 in the United States with a correlation coefficient (R) of 0.309 and weighted average of 4.6%, a difference of 10.0%.
Immigrants from Southern Europe vs Dutch Unemployment Among Ages 55 to 59 years

Unemployment Among Ages 55 to 59 years Correlation Summary

MeasurementImmigrants from Southern EuropeDutch
Minimum1.7%1.0%
Maximum17.4%18.2%
Range15.7%17.2%
Mean6.9%5.4%
Median5.3%4.7%
Interquartile 25% (IQ1)4.5%3.1%
Interquartile 75% (IQ3)8.5%6.7%
Interquartile Range (IQR)4.0%3.6%
Standard Deviation (Sample)3.9%3.4%
Standard Deviation (Population)3.9%3.4%

Similar Demographics by Unemployment Among Ages 55 to 59 years

Demographics Similar to Immigrants from Southern Europe by Unemployment Among Ages 55 to 59 years

In terms of unemployment among ages 55 to 59 years, the demographic groups most similar to Immigrants from Southern Europe are Immigrants from Hong Kong (5.0%, a difference of 0.23%), Immigrants (5.0%, a difference of 0.24%), Albanian (5.0%, a difference of 0.32%), Immigrants from Albania (5.0%, a difference of 0.34%), and Choctaw (5.0%, a difference of 0.35%).
DemographicsRating | RankUnemployment Among Ages 55 to 59 years
Immigrants | Iran
3.7
/100
|
#227
Tragic
5.0%
Immigrants | Liberia
3.2
/100
|
#228
Tragic
5.0%
Immigrants | Western Asia
3.0
/100
|
#229
Tragic
5.0%
Immigrants | Syria
2.7
/100
|
#230
Tragic
5.0%
Cherokee
2.6
/100
|
#231
Tragic
5.0%
Albanians
2.5
/100
|
#232
Tragic
5.0%
Immigrants | Immigrants
2.3
/100
|
#233
Tragic
5.0%
Immigrants | Southern Europe
1.8
/100
|
#234
Tragic
5.0%
Immigrants | Hong Kong
1.4
/100
|
#235
Tragic
5.0%
Immigrants | Albania
1.3
/100
|
#236
Tragic
5.0%
Choctaw
1.3
/100
|
#237
Tragic
5.0%
Moroccans
1.3
/100
|
#238
Tragic
5.0%
French American Indians
1.2
/100
|
#239
Tragic
5.0%
Immigrants | Costa Rica
1.1
/100
|
#240
Tragic
5.0%
Brazilians
1.0
/100
|
#241
Tragic
5.0%

Demographics Similar to Dutch by Unemployment Among Ages 55 to 59 years

In terms of unemployment among ages 55 to 59 years, the demographic groups most similar to Dutch are Immigrants from Uganda (4.6%, a difference of 0.050%), Immigrants from Argentina (4.6%, a difference of 0.090%), Okinawan (4.5%, a difference of 0.27%), Northern European (4.5%, a difference of 0.29%), and Welsh (4.5%, a difference of 0.30%).
DemographicsRating | RankUnemployment Among Ages 55 to 59 years
Immigrants | Middle Africa
99.7
/100
|
#53
Exceptional
4.5%
Burmese
99.7
/100
|
#54
Exceptional
4.5%
Immigrants | Nepal
99.6
/100
|
#55
Exceptional
4.5%
Welsh
99.6
/100
|
#56
Exceptional
4.5%
Northern Europeans
99.6
/100
|
#57
Exceptional
4.5%
Okinawans
99.6
/100
|
#58
Exceptional
4.5%
Immigrants | Uganda
99.5
/100
|
#59
Exceptional
4.6%
Dutch
99.5
/100
|
#60
Exceptional
4.6%
Immigrants | Argentina
99.5
/100
|
#61
Exceptional
4.6%
Slovenes
99.3
/100
|
#62
Exceptional
4.6%
Immigrants | South Central Asia
99.3
/100
|
#63
Exceptional
4.6%
Argentineans
99.1
/100
|
#64
Exceptional
4.6%
Sudanese
99.1
/100
|
#65
Exceptional
4.6%
Mongolians
99.0
/100
|
#66
Exceptional
4.6%
Ugandans
99.0
/100
|
#67
Exceptional
4.6%