Immigrants from South Central Asia vs Ugandan 4th Grade
COMPARE
Immigrants from South Central Asia
Ugandan
4th Grade
4th Grade Comparison
Immigrants from South Central Asia
Ugandans
97.6%
4TH GRADE
76.2/ 100
METRIC RATING
152nd/ 347
METRIC RANK
97.6%
4TH GRADE
58.9/ 100
METRIC RATING
164th/ 347
METRIC RANK
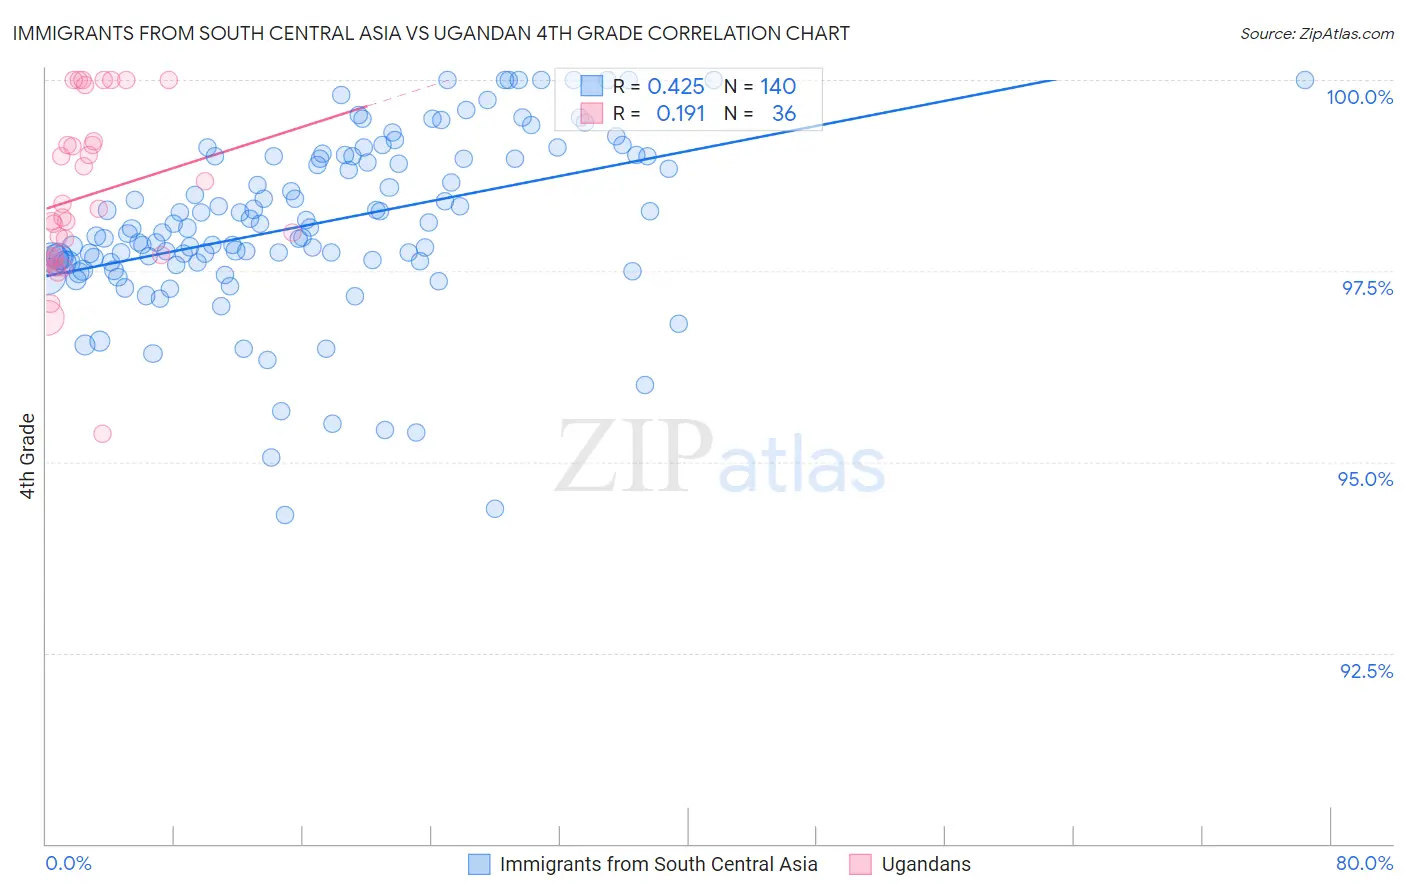
Immigrants from South Central Asia vs Ugandan 4th Grade Correlation Chart
The statistical analysis conducted on geographies consisting of 473,113,181 people shows a moderate positive correlation between the proportion of Immigrants from South Central Asia and percentage of population with at least 4th grade education in the United States with a correlation coefficient (R) of 0.425 and weighted average of 97.6%. Similarly, the statistical analysis conducted on geographies consisting of 93,991,892 people shows a poor positive correlation between the proportion of Ugandans and percentage of population with at least 4th grade education in the United States with a correlation coefficient (R) of 0.191 and weighted average of 97.6%, a difference of 0.080%.
4th Grade Correlation Summary
| Measurement | Immigrants from South Central Asia | Ugandan |
| Minimum | 94.3% | 95.4% |
| Maximum | 100.0% | 100.0% |
| Range | 5.7% | 4.6% |
| Mean | 98.1% | 98.5% |
| Median | 98.1% | 98.3% |
| Interquartile 25% (IQ1) | 97.6% | 97.7% |
| Interquartile 75% (IQ3) | 99.0% | 99.2% |
| Interquartile Range (IQR) | 1.4% | 1.5% |
| Standard Deviation (Sample) | 1.1% | 1.1% |
| Standard Deviation (Population) | 1.1% | 1.1% |
Demographics Similar to Immigrants from South Central Asia and Ugandans by 4th Grade
In terms of 4th grade, the demographic groups most similar to Immigrants from South Central Asia are Soviet Union (97.6%, a difference of 0.010%), Immigrants from Israel (97.6%, a difference of 0.010%), Alsatian (97.6%, a difference of 0.010%), Hopi (97.7%, a difference of 0.020%), and Immigrants from Eastern Europe (97.6%, a difference of 0.020%). Similarly, the demographic groups most similar to Ugandans are Venezuelan (97.6%, a difference of 0.0%), Apache (97.6%, a difference of 0.010%), Marshallese (97.6%, a difference of 0.010%), Bermudan (97.6%, a difference of 0.010%), and Immigrants from Iran (97.6%, a difference of 0.010%).
| Demographics | Rating | Rank | 4th Grade |
| Hopi | 80.6 /100 | #148 | Excellent 97.7% |
| Soviet Union | 77.8 /100 | #149 | Good 97.6% |
| Immigrants | Israel | 77.7 /100 | #150 | Good 97.6% |
| Alsatians | 77.2 /100 | #151 | Good 97.6% |
| Immigrants | South Central Asia | 76.2 /100 | #152 | Good 97.6% |
| Immigrants | Eastern Europe | 71.3 /100 | #153 | Good 97.6% |
| Immigrants | Russia | 67.0 /100 | #154 | Good 97.6% |
| Albanians | 67.0 /100 | #155 | Good 97.6% |
| Immigrants | Jordan | 66.9 /100 | #156 | Good 97.6% |
| Immigrants | Bosnia and Herzegovina | 66.0 /100 | #157 | Good 97.6% |
| French American Indians | 65.9 /100 | #158 | Good 97.6% |
| Immigrants | Italy | 63.7 /100 | #159 | Good 97.6% |
| Apache | 61.3 /100 | #160 | Good 97.6% |
| Marshallese | 60.8 /100 | #161 | Good 97.6% |
| Bermudans | 60.5 /100 | #162 | Good 97.6% |
| Immigrants | Iran | 60.3 /100 | #163 | Good 97.6% |
| Ugandans | 58.9 /100 | #164 | Average 97.6% |
| Venezuelans | 58.7 /100 | #165 | Average 97.6% |
| Kenyans | 56.5 /100 | #166 | Average 97.5% |
| Immigrants | Poland | 55.9 /100 | #167 | Average 97.5% |
| Immigrants | Belarus | 55.8 /100 | #168 | Average 97.5% |