Immigrants from South Central Asia vs Brazilian 4th Grade
COMPARE
Immigrants from South Central Asia
Brazilian
4th Grade
4th Grade Comparison
Immigrants from South Central Asia
Brazilians
97.6%
4TH GRADE
76.2/ 100
METRIC RATING
152nd/ 347
METRIC RANK
97.5%
4TH GRADE
51.5/ 100
METRIC RATING
171st/ 347
METRIC RANK
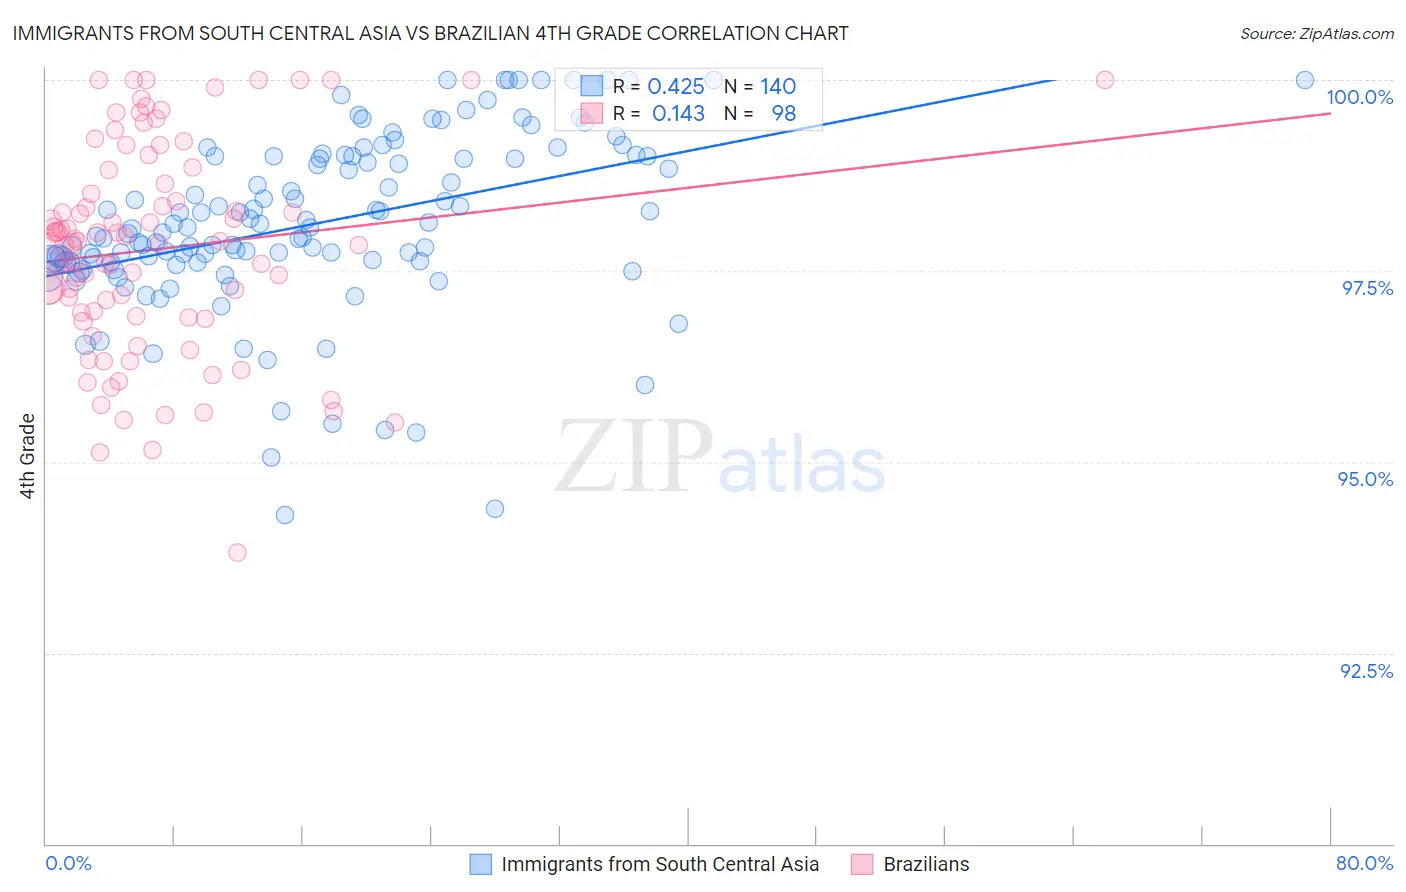
Immigrants from South Central Asia vs Brazilian 4th Grade Correlation Chart
The statistical analysis conducted on geographies consisting of 473,113,181 people shows a moderate positive correlation between the proportion of Immigrants from South Central Asia and percentage of population with at least 4th grade education in the United States with a correlation coefficient (R) of 0.425 and weighted average of 97.6%. Similarly, the statistical analysis conducted on geographies consisting of 323,863,770 people shows a poor positive correlation between the proportion of Brazilians and percentage of population with at least 4th grade education in the United States with a correlation coefficient (R) of 0.143 and weighted average of 97.5%, a difference of 0.10%.
4th Grade Correlation Summary
| Measurement | Immigrants from South Central Asia | Brazilian |
| Minimum | 94.3% | 93.8% |
| Maximum | 100.0% | 100.0% |
| Range | 5.7% | 6.2% |
| Mean | 98.1% | 97.8% |
| Median | 98.1% | 97.9% |
| Interquartile 25% (IQ1) | 97.6% | 96.9% |
| Interquartile 75% (IQ3) | 99.0% | 98.6% |
| Interquartile Range (IQR) | 1.4% | 1.7% |
| Standard Deviation (Sample) | 1.1% | 1.4% |
| Standard Deviation (Population) | 1.1% | 1.4% |
Demographics Similar to Immigrants from South Central Asia and Brazilians by 4th Grade
In terms of 4th grade, the demographic groups most similar to Immigrants from South Central Asia are Alsatian (97.6%, a difference of 0.010%), Immigrants from Eastern Europe (97.6%, a difference of 0.020%), Immigrants from Russia (97.6%, a difference of 0.040%), Albanian (97.6%, a difference of 0.040%), and Immigrants from Jordan (97.6%, a difference of 0.040%). Similarly, the demographic groups most similar to Brazilians are Immigrants from Spain (97.5%, a difference of 0.0%), Chilean (97.5%, a difference of 0.010%), Kenyan (97.5%, a difference of 0.020%), Immigrants from Poland (97.5%, a difference of 0.020%), and Immigrants from Belarus (97.5%, a difference of 0.020%).
| Demographics | Rating | Rank | 4th Grade |
| Alsatians | 77.2 /100 | #151 | Good 97.6% |
| Immigrants | South Central Asia | 76.2 /100 | #152 | Good 97.6% |
| Immigrants | Eastern Europe | 71.3 /100 | #153 | Good 97.6% |
| Immigrants | Russia | 67.0 /100 | #154 | Good 97.6% |
| Albanians | 67.0 /100 | #155 | Good 97.6% |
| Immigrants | Jordan | 66.9 /100 | #156 | Good 97.6% |
| Immigrants | Bosnia and Herzegovina | 66.0 /100 | #157 | Good 97.6% |
| French American Indians | 65.9 /100 | #158 | Good 97.6% |
| Immigrants | Italy | 63.7 /100 | #159 | Good 97.6% |
| Apache | 61.3 /100 | #160 | Good 97.6% |
| Marshallese | 60.8 /100 | #161 | Good 97.6% |
| Bermudans | 60.5 /100 | #162 | Good 97.6% |
| Immigrants | Iran | 60.3 /100 | #163 | Good 97.6% |
| Ugandans | 58.9 /100 | #164 | Average 97.6% |
| Venezuelans | 58.7 /100 | #165 | Average 97.6% |
| Kenyans | 56.5 /100 | #166 | Average 97.5% |
| Immigrants | Poland | 55.9 /100 | #167 | Average 97.5% |
| Immigrants | Belarus | 55.8 /100 | #168 | Average 97.5% |
| Chileans | 54.4 /100 | #169 | Average 97.5% |
| Immigrants | Spain | 51.8 /100 | #170 | Average 97.5% |
| Brazilians | 51.5 /100 | #171 | Average 97.5% |