Immigrants from South America vs Immigrants from Yemen Nursery School
COMPARE
Immigrants from South America
Immigrants from Yemen
Nursery School
Nursery School Comparison
Immigrants from South America
Immigrants from Yemen
97.6%
NURSERY SCHOOL
0.4/ 100
METRIC RATING
260th/ 347
METRIC RANK
95.9%
NURSERY SCHOOL
0.0/ 100
METRIC RATING
346th/ 347
METRIC RANK
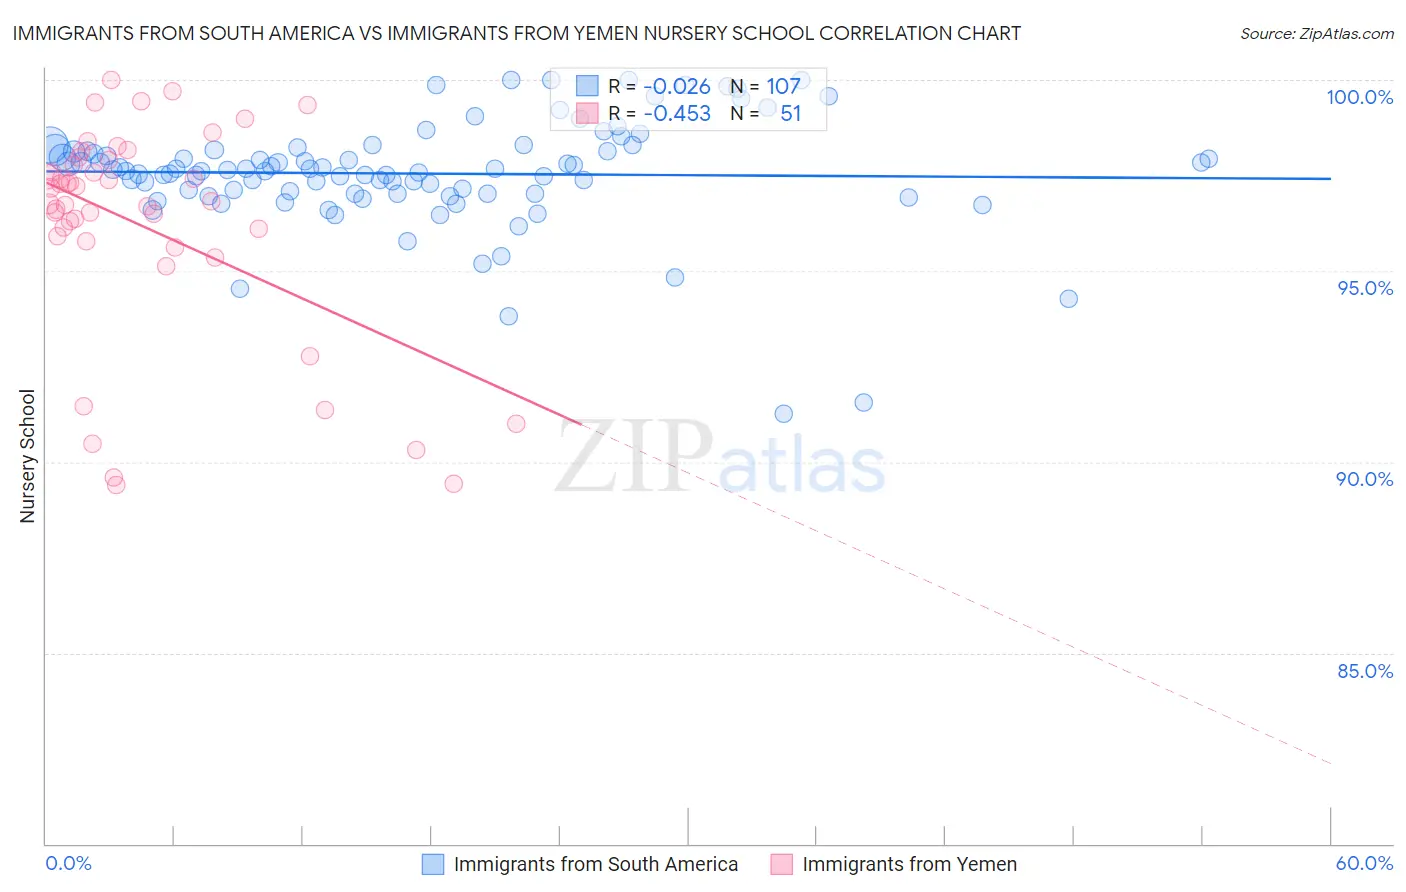
Immigrants from South America vs Immigrants from Yemen Nursery School Correlation Chart
The statistical analysis conducted on geographies consisting of 486,429,719 people shows no correlation between the proportion of Immigrants from South America and percentage of population with at least nursery school education in the United States with a correlation coefficient (R) of -0.026 and weighted average of 97.6%. Similarly, the statistical analysis conducted on geographies consisting of 82,433,611 people shows a moderate negative correlation between the proportion of Immigrants from Yemen and percentage of population with at least nursery school education in the United States with a correlation coefficient (R) of -0.453 and weighted average of 95.9%, a difference of 1.8%.
Nursery School Correlation Summary
| Measurement | Immigrants from South America | Immigrants from Yemen |
| Minimum | 91.3% | 89.4% |
| Maximum | 100.0% | 100.0% |
| Range | 8.7% | 10.6% |
| Mean | 97.5% | 96.2% |
| Median | 97.7% | 96.8% |
| Interquartile 25% (IQ1) | 97.0% | 95.8% |
| Interquartile 75% (IQ3) | 98.2% | 97.9% |
| Interquartile Range (IQR) | 1.1% | 2.1% |
| Standard Deviation (Sample) | 1.5% | 2.8% |
| Standard Deviation (Population) | 1.4% | 2.8% |
Similar Demographics by Nursery School
Demographics Similar to Immigrants from South America by Nursery School
In terms of nursery school, the demographic groups most similar to Immigrants from South America are Armenian (97.6%, a difference of 0.0%), Cuban (97.6%, a difference of 0.0%), Immigrants from Ethiopia (97.6%, a difference of 0.010%), Fijian (97.6%, a difference of 0.010%), and Taiwanese (97.6%, a difference of 0.010%).
| Demographics | Rating | Rank | Nursery School |
| Immigrants | Iraq | 0.7 /100 | #253 | Tragic 97.6% |
| Immigrants | Congo | 0.7 /100 | #254 | Tragic 97.6% |
| Immigrants | Asia | 0.7 /100 | #255 | Tragic 97.6% |
| Yaqui | 0.6 /100 | #256 | Tragic 97.6% |
| Immigrants | Colombia | 0.6 /100 | #257 | Tragic 97.6% |
| Jamaicans | 0.6 /100 | #258 | Tragic 97.6% |
| Armenians | 0.4 /100 | #259 | Tragic 97.6% |
| Immigrants | South America | 0.4 /100 | #260 | Tragic 97.6% |
| Cubans | 0.4 /100 | #261 | Tragic 97.6% |
| Immigrants | Ethiopia | 0.4 /100 | #262 | Tragic 97.6% |
| Fijians | 0.3 /100 | #263 | Tragic 97.6% |
| Taiwanese | 0.3 /100 | #264 | Tragic 97.6% |
| Assyrians/Chaldeans/Syriacs | 0.3 /100 | #265 | Tragic 97.6% |
| Immigrants | Sierra Leone | 0.3 /100 | #266 | Tragic 97.6% |
| Immigrants | Nigeria | 0.3 /100 | #267 | Tragic 97.5% |
Demographics Similar to Immigrants from Yemen by Nursery School
In terms of nursery school, the demographic groups most similar to Immigrants from Yemen are Spanish American Indian (95.8%, a difference of 0.050%), Nepalese (96.2%, a difference of 0.34%), Immigrants from El Salvador (96.2%, a difference of 0.35%), Salvadoran (96.4%, a difference of 0.50%), and Immigrants from Cabo Verde (96.4%, a difference of 0.54%).
| Demographics | Rating | Rank | Nursery School |
| Central Americans | 0.0 /100 | #333 | Tragic 96.6% |
| Immigrants | Dominican Republic | 0.0 /100 | #334 | Tragic 96.6% |
| Bangladeshis | 0.0 /100 | #335 | Tragic 96.6% |
| Guatemalans | 0.0 /100 | #336 | Tragic 96.6% |
| Immigrants | Cambodia | 0.0 /100 | #337 | Tragic 96.5% |
| Immigrants | Fiji | 0.0 /100 | #338 | Tragic 96.5% |
| Immigrants | Guatemala | 0.0 /100 | #339 | Tragic 96.4% |
| Immigrants | Central America | 0.0 /100 | #340 | Tragic 96.4% |
| Immigrants | Cabo Verde | 0.0 /100 | #341 | Tragic 96.4% |
| Immigrants | Mexico | 0.0 /100 | #342 | Tragic 96.4% |
| Salvadorans | 0.0 /100 | #343 | Tragic 96.4% |
| Immigrants | El Salvador | 0.0 /100 | #344 | Tragic 96.2% |
| Nepalese | 0.0 /100 | #345 | Tragic 96.2% |
| Immigrants | Yemen | 0.0 /100 | #346 | Tragic 95.9% |
| Spanish American Indians | 0.0 /100 | #347 | Tragic 95.8% |