Immigrants from South America vs Immigrants from Yemen 8th Grade
COMPARE
Immigrants from South America
Immigrants from Yemen
8th Grade
8th Grade Comparison
Immigrants from South America
Immigrants from Yemen
94.8%
8TH GRADE
0.2/ 100
METRIC RATING
272nd/ 347
METRIC RANK
92.1%
8TH GRADE
0.0/ 100
METRIC RATING
334th/ 347
METRIC RANK
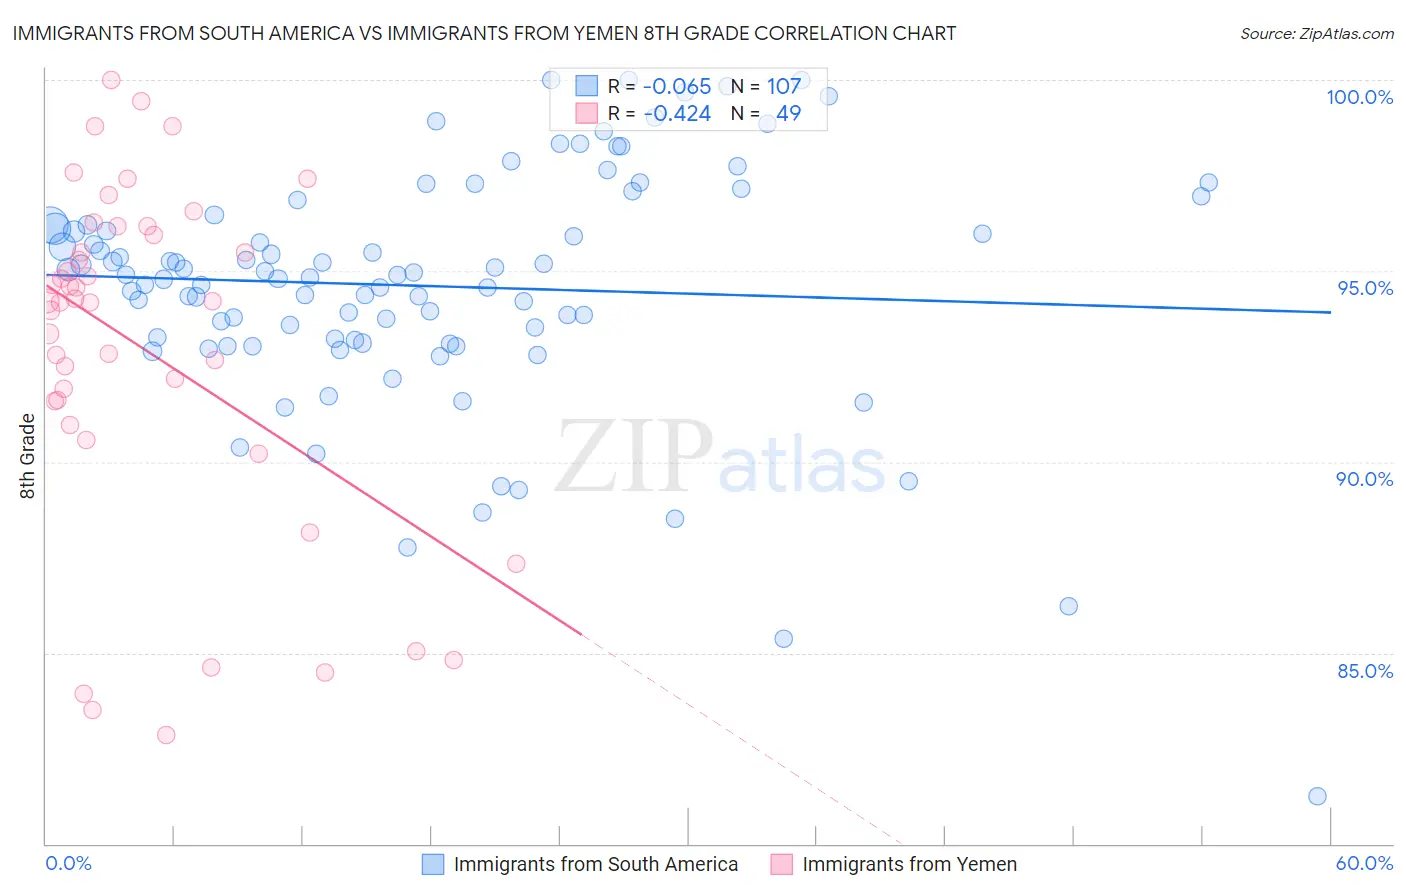
Immigrants from South America vs Immigrants from Yemen 8th Grade Correlation Chart
The statistical analysis conducted on geographies consisting of 486,312,594 people shows a slight negative correlation between the proportion of Immigrants from South America and percentage of population with at least 8th grade education in the United States with a correlation coefficient (R) of -0.065 and weighted average of 94.8%. Similarly, the statistical analysis conducted on geographies consisting of 82,429,885 people shows a moderate negative correlation between the proportion of Immigrants from Yemen and percentage of population with at least 8th grade education in the United States with a correlation coefficient (R) of -0.424 and weighted average of 92.1%, a difference of 2.9%.
8th Grade Correlation Summary
| Measurement | Immigrants from South America | Immigrants from Yemen |
| Minimum | 81.2% | 82.8% |
| Maximum | 100.0% | 100.0% |
| Range | 18.8% | 17.2% |
| Mean | 94.6% | 93.0% |
| Median | 94.9% | 94.2% |
| Interquartile 25% (IQ1) | 93.2% | 91.3% |
| Interquartile 75% (IQ3) | 96.2% | 96.1% |
| Interquartile Range (IQR) | 3.0% | 4.8% |
| Standard Deviation (Sample) | 3.2% | 4.5% |
| Standard Deviation (Population) | 3.1% | 4.4% |
Similar Demographics by 8th Grade
Demographics Similar to Immigrants from South America by 8th Grade
In terms of 8th grade, the demographic groups most similar to Immigrants from South America are Immigrants from Western Africa (94.8%, a difference of 0.0%), Immigrants from Afghanistan (94.8%, a difference of 0.010%), Immigrants from Uzbekistan (94.8%, a difference of 0.020%), Trinidadian and Tobagonian (94.7%, a difference of 0.020%), and Immigrants from Colombia (94.7%, a difference of 0.030%).
| Demographics | Rating | Rank | 8th Grade |
| Yuman | 0.4 /100 | #265 | Tragic 94.9% |
| West Indians | 0.3 /100 | #266 | Tragic 94.8% |
| Immigrants | Ghana | 0.3 /100 | #267 | Tragic 94.8% |
| Immigrants | Uruguay | 0.3 /100 | #268 | Tragic 94.8% |
| Immigrants | Thailand | 0.2 /100 | #269 | Tragic 94.8% |
| Immigrants | Uzbekistan | 0.2 /100 | #270 | Tragic 94.8% |
| Immigrants | Afghanistan | 0.2 /100 | #271 | Tragic 94.8% |
| Immigrants | South America | 0.2 /100 | #272 | Tragic 94.8% |
| Immigrants | Western Africa | 0.2 /100 | #273 | Tragic 94.8% |
| Trinidadians and Tobagonians | 0.2 /100 | #274 | Tragic 94.7% |
| Immigrants | Colombia | 0.2 /100 | #275 | Tragic 94.7% |
| Peruvians | 0.1 /100 | #276 | Tragic 94.7% |
| Taiwanese | 0.1 /100 | #277 | Tragic 94.7% |
| Armenians | 0.1 /100 | #278 | Tragic 94.7% |
| Immigrants | Trinidad and Tobago | 0.1 /100 | #279 | Tragic 94.6% |
Demographics Similar to Immigrants from Yemen by 8th Grade
In terms of 8th grade, the demographic groups most similar to Immigrants from Yemen are Mexican American Indian (92.1%, a difference of 0.050%), Hispanic or Latino (92.2%, a difference of 0.060%), Immigrants from Dominican Republic (92.3%, a difference of 0.18%), Honduran (92.3%, a difference of 0.19%), and Immigrants from Armenia (92.3%, a difference of 0.20%).
| Demographics | Rating | Rank | 8th Grade |
| Immigrants | Azores | 0.0 /100 | #327 | Tragic 92.5% |
| Immigrants | Nicaragua | 0.0 /100 | #328 | Tragic 92.5% |
| Immigrants | Cabo Verde | 0.0 /100 | #329 | Tragic 92.4% |
| Immigrants | Armenia | 0.0 /100 | #330 | Tragic 92.3% |
| Hondurans | 0.0 /100 | #331 | Tragic 92.3% |
| Immigrants | Dominican Republic | 0.0 /100 | #332 | Tragic 92.3% |
| Hispanics or Latinos | 0.0 /100 | #333 | Tragic 92.2% |
| Immigrants | Yemen | 0.0 /100 | #334 | Tragic 92.1% |
| Mexican American Indians | 0.0 /100 | #335 | Tragic 92.1% |
| Immigrants | Honduras | 0.0 /100 | #336 | Tragic 91.9% |
| Immigrants | Latin America | 0.0 /100 | #337 | Tragic 91.7% |
| Central Americans | 0.0 /100 | #338 | Tragic 91.6% |
| Mexicans | 0.0 /100 | #339 | Tragic 91.4% |
| Yakama | 0.0 /100 | #340 | Tragic 91.2% |
| Guatemalans | 0.0 /100 | #341 | Tragic 91.1% |