Immigrants from Ethiopia vs Dominican 4th Grade
COMPARE
Immigrants from Ethiopia
Dominican
4th Grade
4th Grade Comparison
Immigrants from Ethiopia
Dominicans
97.0%
4TH GRADE
0.4/ 100
METRIC RATING
259th/ 347
METRIC RANK
96.0%
4TH GRADE
0.0/ 100
METRIC RATING
325th/ 347
METRIC RANK
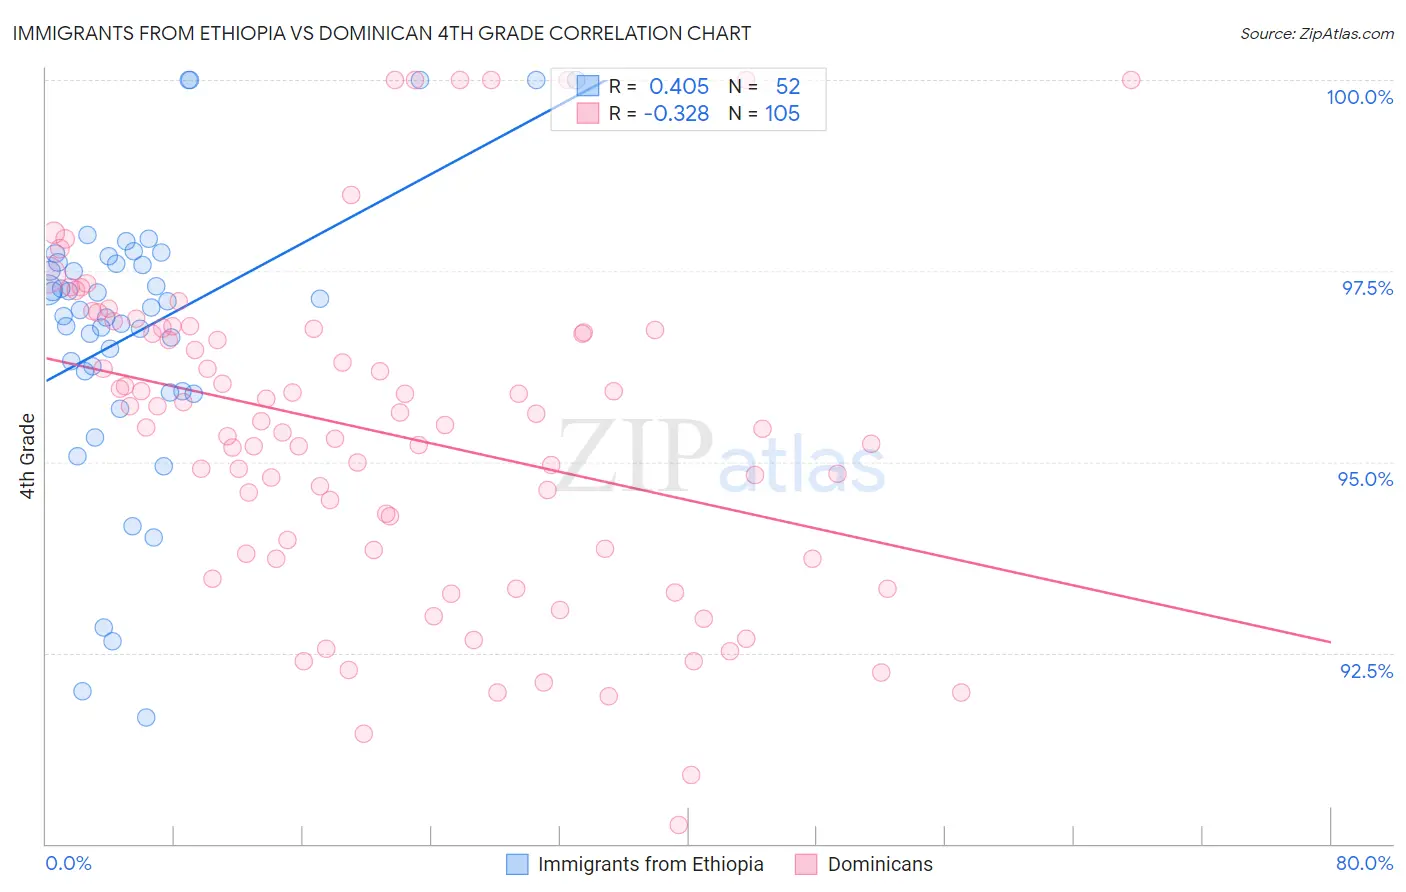
Immigrants from Ethiopia vs Dominican 4th Grade Correlation Chart
The statistical analysis conducted on geographies consisting of 211,514,076 people shows a moderate positive correlation between the proportion of Immigrants from Ethiopia and percentage of population with at least 4th grade education in the United States with a correlation coefficient (R) of 0.405 and weighted average of 97.0%. Similarly, the statistical analysis conducted on geographies consisting of 355,142,603 people shows a mild negative correlation between the proportion of Dominicans and percentage of population with at least 4th grade education in the United States with a correlation coefficient (R) of -0.328 and weighted average of 96.0%, a difference of 1.1%.
4th Grade Correlation Summary
| Measurement | Immigrants from Ethiopia | Dominican |
| Minimum | 91.7% | 90.2% |
| Maximum | 100.0% | 100.0% |
| Range | 8.3% | 9.8% |
| Mean | 96.7% | 95.4% |
| Median | 97.0% | 95.5% |
| Interquartile 25% (IQ1) | 96.1% | 93.8% |
| Interquartile 75% (IQ3) | 97.6% | 96.7% |
| Interquartile Range (IQR) | 1.5% | 2.9% |
| Standard Deviation (Sample) | 1.8% | 2.1% |
| Standard Deviation (Population) | 1.8% | 2.1% |
Similar Demographics by 4th Grade
Demographics Similar to Immigrants from Ethiopia by 4th Grade
In terms of 4th grade, the demographic groups most similar to Immigrants from Ethiopia are Immigrants from Congo (97.0%, a difference of 0.010%), Immigrants from Colombia (97.0%, a difference of 0.010%), Immigrants from Sierra Leone (97.0%, a difference of 0.010%), Immigrants from South America (97.0%, a difference of 0.020%), and West Indian (97.0%, a difference of 0.020%).
| Demographics | Rating | Rank | 4th Grade |
| Jamaicans | 0.8 /100 | #252 | Tragic 97.1% |
| Immigrants | Liberia | 0.8 /100 | #253 | Tragic 97.1% |
| Immigrants | Middle Africa | 0.8 /100 | #254 | Tragic 97.1% |
| Peruvians | 0.7 /100 | #255 | Tragic 97.1% |
| Bolivians | 0.7 /100 | #256 | Tragic 97.1% |
| Immigrants | Congo | 0.5 /100 | #257 | Tragic 97.0% |
| Immigrants | Colombia | 0.5 /100 | #258 | Tragic 97.0% |
| Immigrants | Ethiopia | 0.4 /100 | #259 | Tragic 97.0% |
| Immigrants | Sierra Leone | 0.4 /100 | #260 | Tragic 97.0% |
| Immigrants | South America | 0.4 /100 | #261 | Tragic 97.0% |
| West Indians | 0.4 /100 | #262 | Tragic 97.0% |
| Immigrants | Jamaica | 0.3 /100 | #263 | Tragic 97.0% |
| Taiwanese | 0.3 /100 | #264 | Tragic 97.0% |
| Armenians | 0.3 /100 | #265 | Tragic 97.0% |
| Immigrants | China | 0.3 /100 | #266 | Tragic 97.0% |
Demographics Similar to Dominicans by 4th Grade
In terms of 4th grade, the demographic groups most similar to Dominicans are Immigrants from Belize (96.0%, a difference of 0.010%), Hispanic or Latino (96.0%, a difference of 0.010%), Immigrants from Nicaragua (96.0%, a difference of 0.020%), Honduran (96.0%, a difference of 0.020%), and Japanese (96.0%, a difference of 0.040%).
| Demographics | Rating | Rank | 4th Grade |
| Immigrants | Azores | 0.0 /100 | #318 | Tragic 96.1% |
| Belizeans | 0.0 /100 | #319 | Tragic 96.1% |
| Bangladeshis | 0.0 /100 | #320 | Tragic 96.1% |
| Japanese | 0.0 /100 | #321 | Tragic 96.0% |
| Immigrants | Vietnam | 0.0 /100 | #322 | Tragic 96.0% |
| Immigrants | Nicaragua | 0.0 /100 | #323 | Tragic 96.0% |
| Immigrants | Belize | 0.0 /100 | #324 | Tragic 96.0% |
| Dominicans | 0.0 /100 | #325 | Tragic 96.0% |
| Hispanics or Latinos | 0.0 /100 | #326 | Tragic 96.0% |
| Hondurans | 0.0 /100 | #327 | Tragic 96.0% |
| Mexican American Indians | 0.0 /100 | #328 | Tragic 95.8% |
| Immigrants | Cambodia | 0.0 /100 | #329 | Tragic 95.8% |
| Immigrants | Fiji | 0.0 /100 | #330 | Tragic 95.8% |
| Immigrants | Armenia | 0.0 /100 | #331 | Tragic 95.8% |
| Immigrants | Honduras | 0.0 /100 | #332 | Tragic 95.8% |