Immigrants from Somalia vs Slovene Disability Age 18 to 34
COMPARE
Immigrants from Somalia
Slovene
Disability Age 18 to 34
Disability Age 18 to 34 Comparison
Immigrants from Somalia
Slovenes
7.4%
DISABILITY AGE 18 TO 34
0.1/ 100
METRIC RATING
275th/ 347
METRIC RANK
7.3%
DISABILITY AGE 18 TO 34
0.1/ 100
METRIC RATING
265th/ 347
METRIC RANK
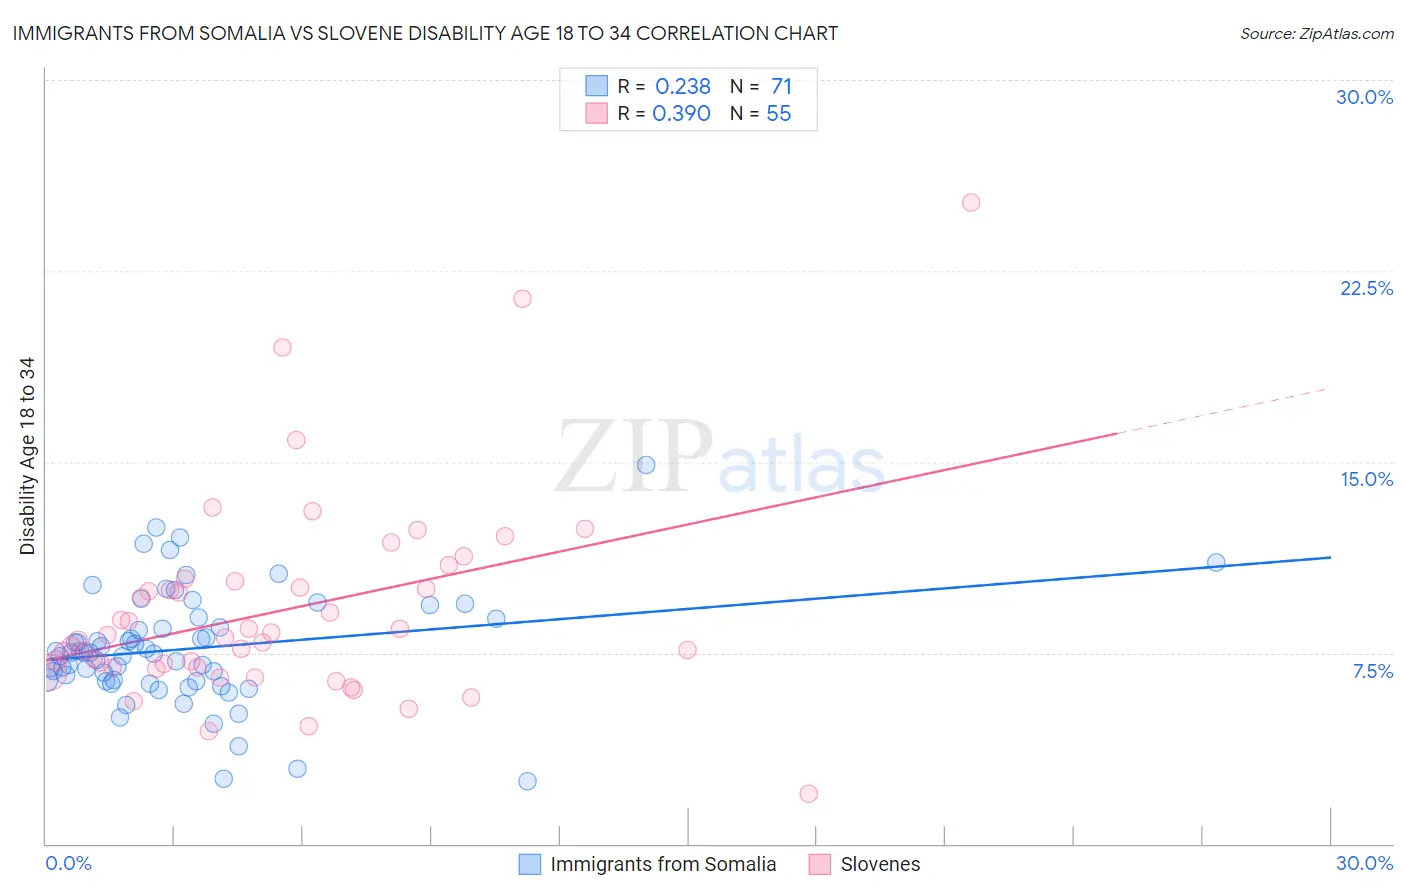
Immigrants from Somalia vs Slovene Disability Age 18 to 34 Correlation Chart
The statistical analysis conducted on geographies consisting of 92,071,714 people shows a weak positive correlation between the proportion of Immigrants from Somalia and percentage of population with a disability between the ages 18 and 35 in the United States with a correlation coefficient (R) of 0.238 and weighted average of 7.4%. Similarly, the statistical analysis conducted on geographies consisting of 260,842,268 people shows a mild positive correlation between the proportion of Slovenes and percentage of population with a disability between the ages 18 and 35 in the United States with a correlation coefficient (R) of 0.390 and weighted average of 7.3%, a difference of 0.71%.
Disability Age 18 to 34 Correlation Summary
| Measurement | Immigrants from Somalia | Slovene |
| Minimum | 2.5% | 2.0% |
| Maximum | 14.9% | 25.2% |
| Range | 12.4% | 23.2% |
| Mean | 7.7% | 9.2% |
| Median | 7.5% | 8.1% |
| Interquartile 25% (IQ1) | 6.4% | 6.9% |
| Interquartile 75% (IQ3) | 8.8% | 10.3% |
| Interquartile Range (IQR) | 2.5% | 3.4% |
| Standard Deviation (Sample) | 2.2% | 4.0% |
| Standard Deviation (Population) | 2.2% | 4.0% |
Demographics Similar to Immigrants from Somalia and Slovenes by Disability Age 18 to 34
In terms of disability age 18 to 34, the demographic groups most similar to Immigrants from Somalia are European (7.4%, a difference of 0.050%), African (7.4%, a difference of 0.070%), Slavic (7.4%, a difference of 0.080%), Tsimshian (7.4%, a difference of 0.13%), and Swiss (7.4%, a difference of 0.22%). Similarly, the demographic groups most similar to Slovenes are Bermudan (7.3%, a difference of 0.020%), German Russian (7.4%, a difference of 0.17%), Bangladeshi (7.4%, a difference of 0.23%), British (7.3%, a difference of 0.28%), and Portuguese (7.4%, a difference of 0.30%).
| Demographics | Rating | Rank | Disability Age 18 to 34 |
| Tohono O'odham | 0.2 /100 | #260 | Tragic 7.3% |
| Northern Europeans | 0.2 /100 | #261 | Tragic 7.3% |
| Canadians | 0.2 /100 | #262 | Tragic 7.3% |
| British | 0.2 /100 | #263 | Tragic 7.3% |
| Bermudans | 0.1 /100 | #264 | Tragic 7.3% |
| Slovenes | 0.1 /100 | #265 | Tragic 7.3% |
| German Russians | 0.1 /100 | #266 | Tragic 7.4% |
| Bangladeshis | 0.1 /100 | #267 | Tragic 7.4% |
| Portuguese | 0.1 /100 | #268 | Tragic 7.4% |
| Basques | 0.1 /100 | #269 | Tragic 7.4% |
| Belgians | 0.1 /100 | #270 | Tragic 7.4% |
| Swiss | 0.1 /100 | #271 | Tragic 7.4% |
| Tsimshian | 0.1 /100 | #272 | Tragic 7.4% |
| Slavs | 0.1 /100 | #273 | Tragic 7.4% |
| Africans | 0.1 /100 | #274 | Tragic 7.4% |
| Immigrants | Somalia | 0.1 /100 | #275 | Tragic 7.4% |
| Europeans | 0.1 /100 | #276 | Tragic 7.4% |
| Immigrants | Portugal | 0.1 /100 | #277 | Tragic 7.4% |
| Lumbee | 0.1 /100 | #278 | Tragic 7.4% |
| Czechoslovakians | 0.1 /100 | #279 | Tragic 7.4% |
| Yaqui | 0.1 /100 | #280 | Tragic 7.4% |