Immigrants from Pakistan vs Native/Alaskan Nursery School
COMPARE
Immigrants from Pakistan
Native/Alaskan
Nursery School
Nursery School Comparison
Immigrants from Pakistan
Natives/Alaskans
97.7%
NURSERY SCHOOL
2.1/ 100
METRIC RATING
235th/ 347
METRIC RANK
98.0%
NURSERY SCHOOL
48.6/ 100
METRIC RATING
178th/ 347
METRIC RANK
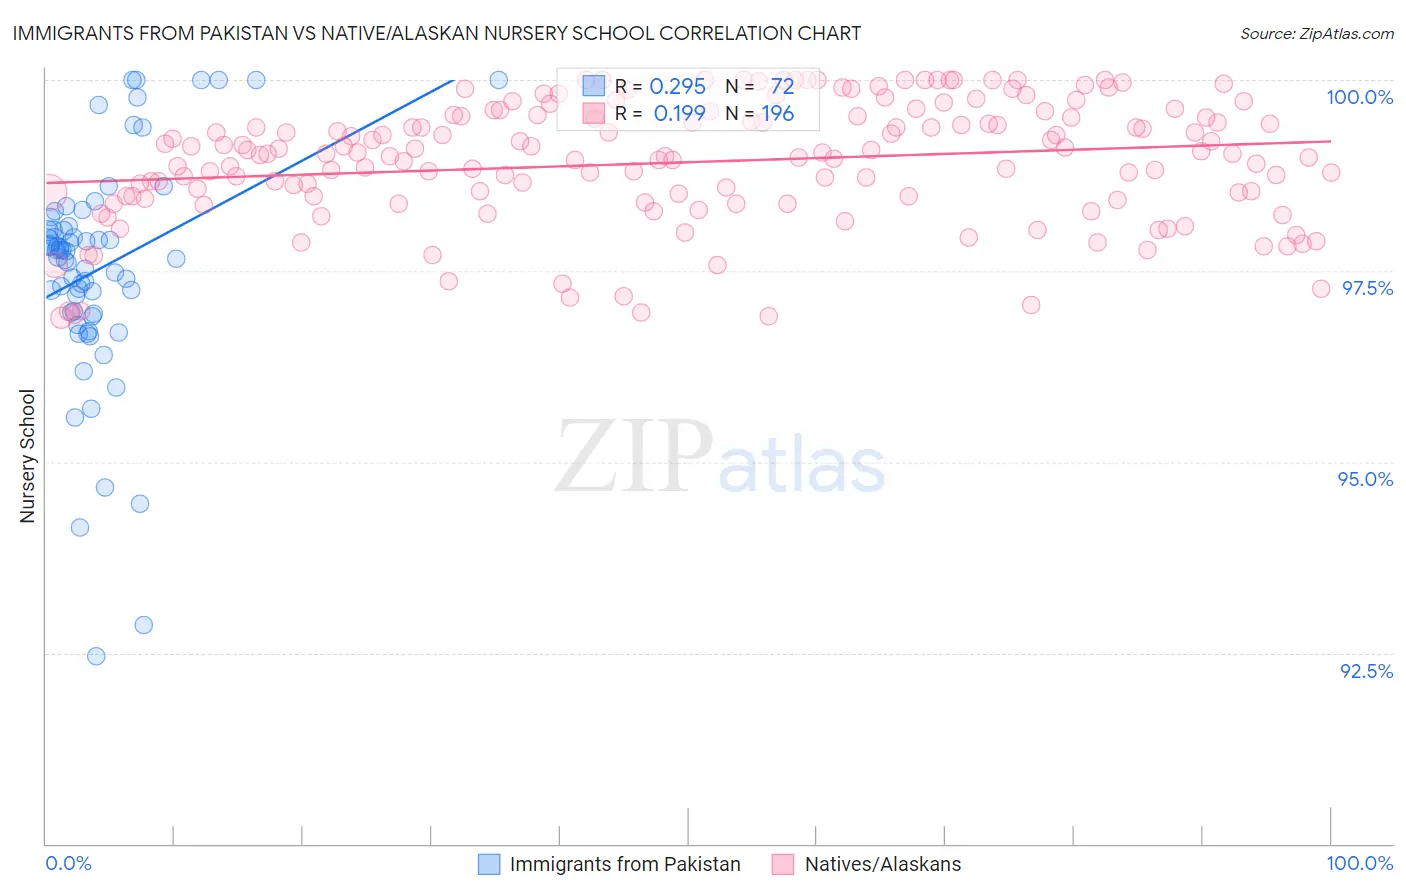
Immigrants from Pakistan vs Native/Alaskan Nursery School Correlation Chart
The statistical analysis conducted on geographies consisting of 283,901,001 people shows a weak positive correlation between the proportion of Immigrants from Pakistan and percentage of population with at least nursery school education in the United States with a correlation coefficient (R) of 0.295 and weighted average of 97.7%. Similarly, the statistical analysis conducted on geographies consisting of 513,036,548 people shows a poor positive correlation between the proportion of Natives/Alaskans and percentage of population with at least nursery school education in the United States with a correlation coefficient (R) of 0.199 and weighted average of 98.0%, a difference of 0.29%.
Nursery School Correlation Summary
| Measurement | Immigrants from Pakistan | Native/Alaskan |
| Minimum | 92.5% | 96.9% |
| Maximum | 100.0% | 100.0% |
| Range | 7.5% | 3.1% |
| Mean | 97.5% | 98.9% |
| Median | 97.7% | 99.0% |
| Interquartile 25% (IQ1) | 96.9% | 98.5% |
| Interquartile 75% (IQ3) | 98.1% | 99.5% |
| Interquartile Range (IQR) | 1.1% | 1.1% |
| Standard Deviation (Sample) | 1.5% | 0.79% |
| Standard Deviation (Population) | 1.5% | 0.79% |
Similar Demographics by Nursery School
Demographics Similar to Immigrants from Pakistan by Nursery School
In terms of nursery school, the demographic groups most similar to Immigrants from Pakistan are U.S. Virgin Islander (97.7%, a difference of 0.0%), Colombian (97.7%, a difference of 0.0%), Immigrants from Uruguay (97.7%, a difference of 0.010%), Immigrants from Malaysia (97.7%, a difference of 0.010%), and Immigrants from Western Asia (97.7%, a difference of 0.010%).
| Demographics | Rating | Rank | Nursery School |
| Sudanese | 3.2 /100 | #228 | Tragic 97.7% |
| Senegalese | 3.2 /100 | #229 | Tragic 97.7% |
| Sierra Leoneans | 2.9 /100 | #230 | Tragic 97.7% |
| Puerto Ricans | 2.6 /100 | #231 | Tragic 97.7% |
| Immigrants | Uruguay | 2.3 /100 | #232 | Tragic 97.7% |
| U.S. Virgin Islanders | 2.1 /100 | #233 | Tragic 97.7% |
| Colombians | 2.1 /100 | #234 | Tragic 97.7% |
| Immigrants | Pakistan | 2.1 /100 | #235 | Tragic 97.7% |
| Immigrants | Malaysia | 1.9 /100 | #236 | Tragic 97.7% |
| Immigrants | Western Asia | 1.9 /100 | #237 | Tragic 97.7% |
| Nigerians | 1.7 /100 | #238 | Tragic 97.7% |
| Immigrants | Eastern Asia | 1.6 /100 | #239 | Tragic 97.7% |
| Koreans | 1.4 /100 | #240 | Tragic 97.7% |
| Immigrants | Indonesia | 1.1 /100 | #241 | Tragic 97.7% |
| Liberians | 1.1 /100 | #242 | Tragic 97.7% |
Demographics Similar to Natives/Alaskans by Nursery School
In terms of nursery school, the demographic groups most similar to Natives/Alaskans are Kenyan (98.0%, a difference of 0.0%), Navajo (98.0%, a difference of 0.0%), Immigrants from Sri Lanka (98.0%, a difference of 0.0%), Immigrants from Venezuela (98.0%, a difference of 0.0%), and Albanian (98.0%, a difference of 0.0%).
| Demographics | Rating | Rank | Nursery School |
| Immigrants | Jordan | 53.4 /100 | #171 | Average 98.0% |
| Immigrants | Brazil | 51.3 /100 | #172 | Average 98.0% |
| Kenyans | 50.2 /100 | #173 | Average 98.0% |
| Navajo | 50.0 /100 | #174 | Average 98.0% |
| Immigrants | Sri Lanka | 49.9 /100 | #175 | Average 98.0% |
| Immigrants | Venezuela | 49.8 /100 | #176 | Average 98.0% |
| Albanians | 48.9 /100 | #177 | Average 98.0% |
| Natives/Alaskans | 48.6 /100 | #178 | Average 98.0% |
| Argentineans | 46.8 /100 | #179 | Average 98.0% |
| Immigrants | Bosnia and Herzegovina | 45.6 /100 | #180 | Average 98.0% |
| Egyptians | 42.8 /100 | #181 | Average 98.0% |
| Paiute | 42.0 /100 | #182 | Average 98.0% |
| Portuguese | 41.8 /100 | #183 | Average 98.0% |
| Immigrants | Poland | 41.3 /100 | #184 | Average 98.0% |
| Immigrants | Belarus | 41.0 /100 | #185 | Average 98.0% |