Immigrants from Serbia vs Immigrants from Bangladesh 12th Grade, No Diploma
COMPARE
Immigrants from Serbia
Immigrants from Bangladesh
12th Grade, No Diploma
12th Grade, No Diploma Comparison
Immigrants from Serbia
Immigrants from Bangladesh
92.4%
12TH GRADE, NO DIPLOMA
98.6/ 100
METRIC RATING
90th/ 347
METRIC RANK
88.0%
12TH GRADE, NO DIPLOMA
0.0/ 100
METRIC RATING
303rd/ 347
METRIC RANK
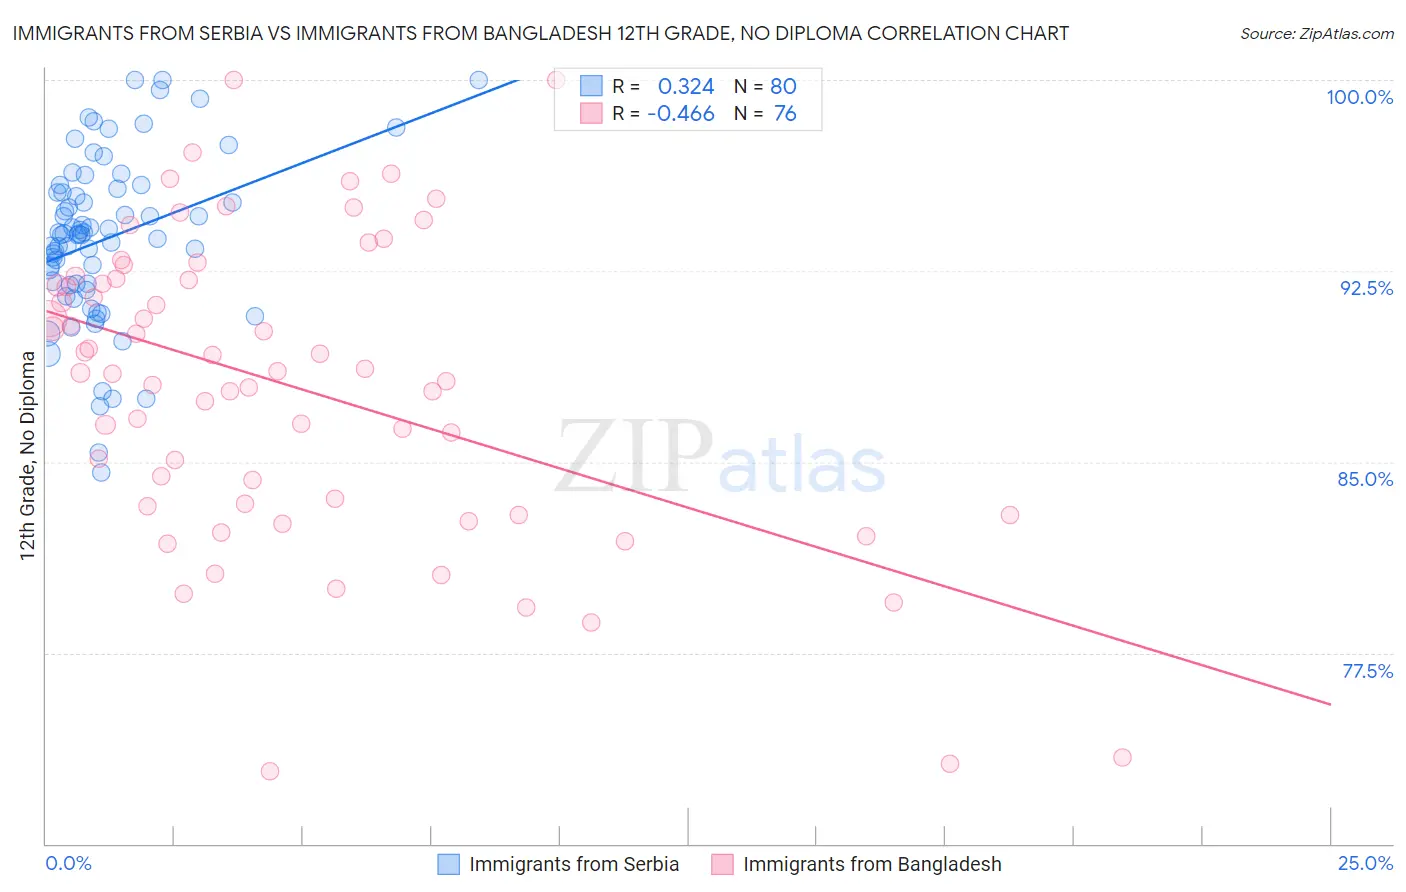
Immigrants from Serbia vs Immigrants from Bangladesh 12th Grade, No Diploma Correlation Chart
The statistical analysis conducted on geographies consisting of 131,745,658 people shows a mild positive correlation between the proportion of Immigrants from Serbia and percentage of population with at least 12th grade (no diploma) education in the United States with a correlation coefficient (R) of 0.324 and weighted average of 92.4%. Similarly, the statistical analysis conducted on geographies consisting of 203,672,706 people shows a moderate negative correlation between the proportion of Immigrants from Bangladesh and percentage of population with at least 12th grade (no diploma) education in the United States with a correlation coefficient (R) of -0.466 and weighted average of 88.0%, a difference of 5.0%.
12th Grade, No Diploma Correlation Summary
| Measurement | Immigrants from Serbia | Immigrants from Bangladesh |
| Minimum | 84.6% | 72.9% |
| Maximum | 100.0% | 100.0% |
| Range | 15.4% | 27.1% |
| Mean | 93.8% | 88.0% |
| Median | 93.9% | 88.5% |
| Interquartile 25% (IQ1) | 92.0% | 83.3% |
| Interquartile 75% (IQ3) | 95.7% | 92.2% |
| Interquartile Range (IQR) | 3.7% | 8.9% |
| Standard Deviation (Sample) | 3.3% | 6.0% |
| Standard Deviation (Population) | 3.3% | 5.9% |
Similar Demographics by 12th Grade, No Diploma
Demographics Similar to Immigrants from Serbia by 12th Grade, No Diploma
In terms of 12th grade, no diploma, the demographic groups most similar to Immigrants from Serbia are Canadian (92.4%, a difference of 0.010%), South African (92.4%, a difference of 0.010%), Immigrants from Romania (92.3%, a difference of 0.020%), Immigrants from Western Europe (92.3%, a difference of 0.020%), and Immigrants from Europe (92.3%, a difference of 0.030%).
| Demographics | Rating | Rank | 12th Grade, No Diploma |
| Immigrants | Israel | 99.2 /100 | #83 | Exceptional 92.5% |
| Immigrants | Bulgaria | 99.1 /100 | #84 | Exceptional 92.5% |
| Immigrants | Saudi Arabia | 99.0 /100 | #85 | Exceptional 92.5% |
| Immigrants | Turkey | 98.9 /100 | #86 | Exceptional 92.4% |
| Immigrants | France | 98.8 /100 | #87 | Exceptional 92.4% |
| Scotch-Irish | 98.8 /100 | #88 | Exceptional 92.4% |
| Canadians | 98.7 /100 | #89 | Exceptional 92.4% |
| Immigrants | Serbia | 98.6 /100 | #90 | Exceptional 92.4% |
| South Africans | 98.6 /100 | #91 | Exceptional 92.4% |
| Immigrants | Romania | 98.5 /100 | #92 | Exceptional 92.3% |
| Immigrants | Western Europe | 98.5 /100 | #93 | Exceptional 92.3% |
| Immigrants | Europe | 98.5 /100 | #94 | Exceptional 92.3% |
| Immigrants | North Macedonia | 98.5 /100 | #95 | Exceptional 92.3% |
| Icelanders | 98.5 /100 | #96 | Exceptional 92.3% |
| Celtics | 98.4 /100 | #97 | Exceptional 92.3% |
Demographics Similar to Immigrants from Bangladesh by 12th Grade, No Diploma
In terms of 12th grade, no diploma, the demographic groups most similar to Immigrants from Bangladesh are Vietnamese (87.9%, a difference of 0.060%), Ecuadorian (88.0%, a difference of 0.10%), Immigrants from Guyana (88.1%, a difference of 0.13%), Immigrants from Cambodia (88.1%, a difference of 0.13%), and Nepalese (88.1%, a difference of 0.18%).
| Demographics | Rating | Rank | 12th Grade, No Diploma |
| Fijians | 0.0 /100 | #296 | Tragic 88.2% |
| Pueblo | 0.0 /100 | #297 | Tragic 88.2% |
| Immigrants | Haiti | 0.0 /100 | #298 | Tragic 88.2% |
| Nepalese | 0.0 /100 | #299 | Tragic 88.1% |
| Immigrants | Guyana | 0.0 /100 | #300 | Tragic 88.1% |
| Immigrants | Cambodia | 0.0 /100 | #301 | Tragic 88.1% |
| Ecuadorians | 0.0 /100 | #302 | Tragic 88.0% |
| Immigrants | Bangladesh | 0.0 /100 | #303 | Tragic 88.0% |
| Vietnamese | 0.0 /100 | #304 | Tragic 87.9% |
| Immigrants | Dominica | 0.0 /100 | #305 | Tragic 87.7% |
| Natives/Alaskans | 0.0 /100 | #306 | Tragic 87.7% |
| Immigrants | Portugal | 0.0 /100 | #307 | Tragic 87.6% |
| Yup'ik | 0.0 /100 | #308 | Tragic 87.6% |
| Immigrants | Armenia | 0.0 /100 | #309 | Tragic 87.6% |
| Immigrants | Cuba | 0.0 /100 | #310 | Tragic 87.5% |