Immigrants from Bahamas vs Israeli 8th Grade
COMPARE
Immigrants from Bahamas
Israeli
8th Grade
8th Grade Comparison
Immigrants from Bahamas
Israelis
95.5%
8TH GRADE
16.7/ 100
METRIC RATING
205th/ 347
METRIC RANK
96.0%
8TH GRADE
84.1/ 100
METRIC RATING
146th/ 347
METRIC RANK
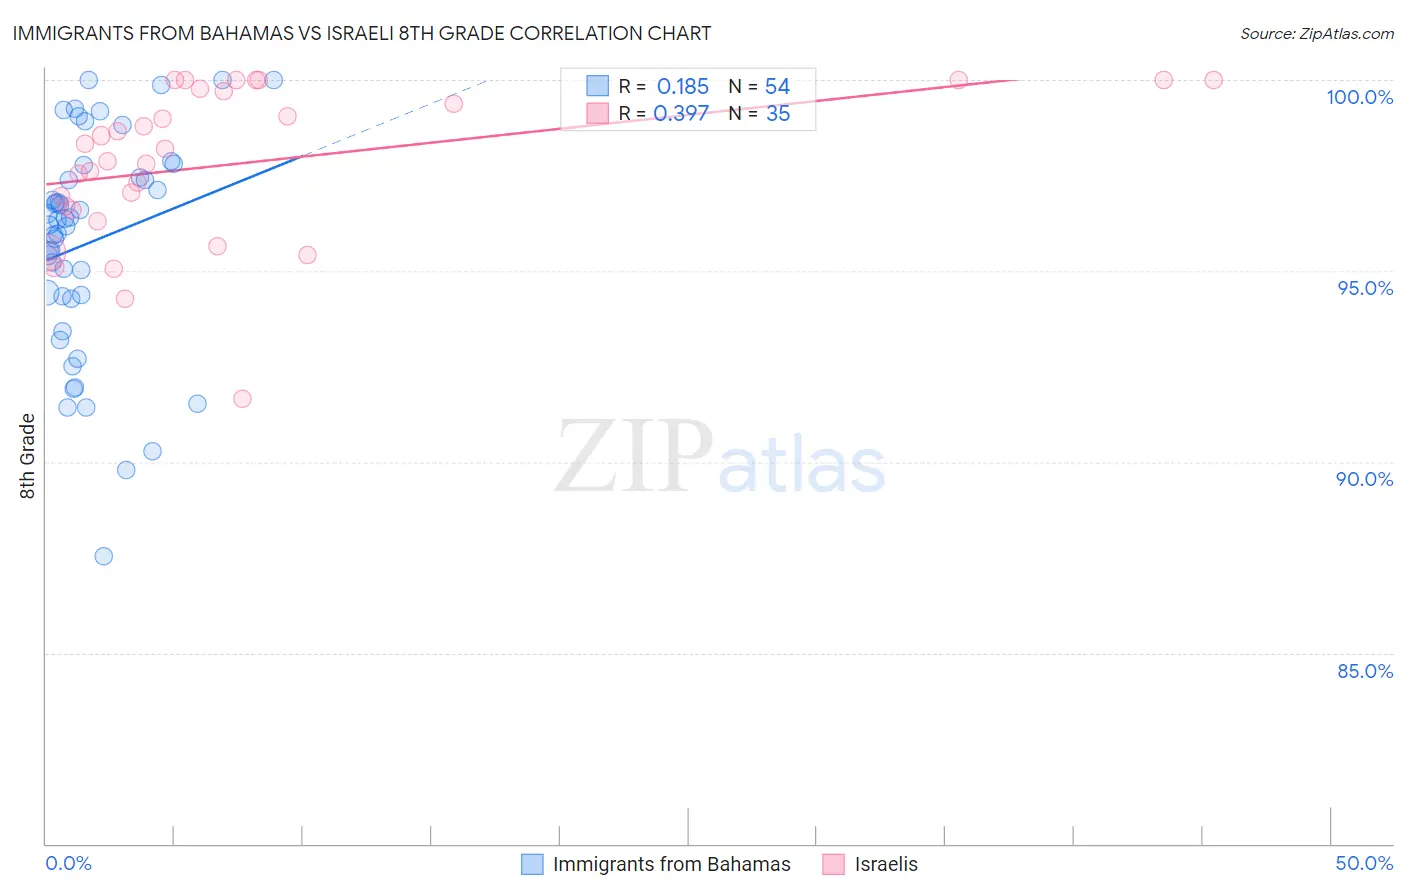
Immigrants from Bahamas vs Israeli 8th Grade Correlation Chart
The statistical analysis conducted on geographies consisting of 104,666,801 people shows a poor positive correlation between the proportion of Immigrants from Bahamas and percentage of population with at least 8th grade education in the United States with a correlation coefficient (R) of 0.185 and weighted average of 95.5%. Similarly, the statistical analysis conducted on geographies consisting of 211,220,151 people shows a mild positive correlation between the proportion of Israelis and percentage of population with at least 8th grade education in the United States with a correlation coefficient (R) of 0.397 and weighted average of 96.0%, a difference of 0.53%.
8th Grade Correlation Summary
| Measurement | Immigrants from Bahamas | Israeli |
| Minimum | 87.5% | 91.7% |
| Maximum | 100.0% | 100.0% |
| Range | 12.5% | 8.3% |
| Mean | 95.7% | 97.8% |
| Median | 96.3% | 98.2% |
| Interquartile 25% (IQ1) | 94.3% | 96.6% |
| Interquartile 75% (IQ3) | 97.4% | 99.8% |
| Interquartile Range (IQR) | 3.1% | 3.1% |
| Standard Deviation (Sample) | 2.8% | 2.0% |
| Standard Deviation (Population) | 2.8% | 2.0% |
Similar Demographics by 8th Grade
Demographics Similar to Immigrants from Bahamas by 8th Grade
In terms of 8th grade, the demographic groups most similar to Immigrants from Bahamas are Hawaiian (95.5%, a difference of 0.0%), Comanche (95.5%, a difference of 0.0%), Moroccan (95.5%, a difference of 0.010%), Immigrants from Sudan (95.5%, a difference of 0.020%), and Apache (95.5%, a difference of 0.030%).
| Demographics | Rating | Rank | 8th Grade |
| Paraguayans | 22.6 /100 | #198 | Fair 95.5% |
| Immigrants | Northern Africa | 22.5 /100 | #199 | Fair 95.5% |
| Argentineans | 22.2 /100 | #200 | Fair 95.5% |
| Immigrants | Argentina | 20.6 /100 | #201 | Fair 95.5% |
| Apache | 19.4 /100 | #202 | Poor 95.5% |
| Moroccans | 17.4 /100 | #203 | Poor 95.5% |
| Hawaiians | 16.7 /100 | #204 | Poor 95.5% |
| Immigrants | Bahamas | 16.7 /100 | #205 | Poor 95.5% |
| Comanche | 16.3 /100 | #206 | Poor 95.5% |
| Immigrants | Sudan | 15.1 /100 | #207 | Poor 95.5% |
| Portuguese | 14.3 /100 | #208 | Poor 95.5% |
| Immigrants | Lebanon | 13.7 /100 | #209 | Poor 95.4% |
| Africans | 13.6 /100 | #210 | Poor 95.4% |
| Immigrants | Morocco | 12.4 /100 | #211 | Poor 95.4% |
| Immigrants | Pakistan | 9.7 /100 | #212 | Tragic 95.4% |
Demographics Similar to Israelis by 8th Grade
In terms of 8th grade, the demographic groups most similar to Israelis are Lumbee (96.0%, a difference of 0.0%), Colville (96.0%, a difference of 0.0%), Spanish (96.0%, a difference of 0.010%), Immigrants from Belarus (96.0%, a difference of 0.010%), and Albanian (96.0%, a difference of 0.010%).
| Demographics | Rating | Rank | 8th Grade |
| Hmong | 89.7 /100 | #139 | Excellent 96.1% |
| Immigrants | South Central Asia | 89.4 /100 | #140 | Excellent 96.1% |
| Immigrants | Greece | 85.9 /100 | #141 | Excellent 96.0% |
| Immigrants | Eastern Europe | 85.4 /100 | #142 | Excellent 96.0% |
| Spanish | 85.1 /100 | #143 | Excellent 96.0% |
| Immigrants | Belarus | 84.8 /100 | #144 | Excellent 96.0% |
| Lumbee | 84.1 /100 | #145 | Excellent 96.0% |
| Israelis | 84.1 /100 | #146 | Excellent 96.0% |
| Colville | 84.0 /100 | #147 | Excellent 96.0% |
| Albanians | 83.1 /100 | #148 | Excellent 96.0% |
| Immigrants | Israel | 81.3 /100 | #149 | Excellent 96.0% |
| Immigrants | Russia | 80.9 /100 | #150 | Excellent 96.0% |
| Blackfeet | 80.8 /100 | #151 | Excellent 96.0% |
| French American Indians | 80.6 /100 | #152 | Excellent 96.0% |
| Immigrants | Jordan | 79.5 /100 | #153 | Good 95.9% |