Immigrants from Scotland vs Liberian Kindergarten
COMPARE
Immigrants from Scotland
Liberian
Kindergarten
Kindergarten Comparison
Immigrants from Scotland
Liberians
98.4%
KINDERGARTEN
99.8/ 100
METRIC RATING
55th/ 347
METRIC RANK
97.6%
KINDERGARTEN
1.3/ 100
METRIC RATING
241st/ 347
METRIC RANK
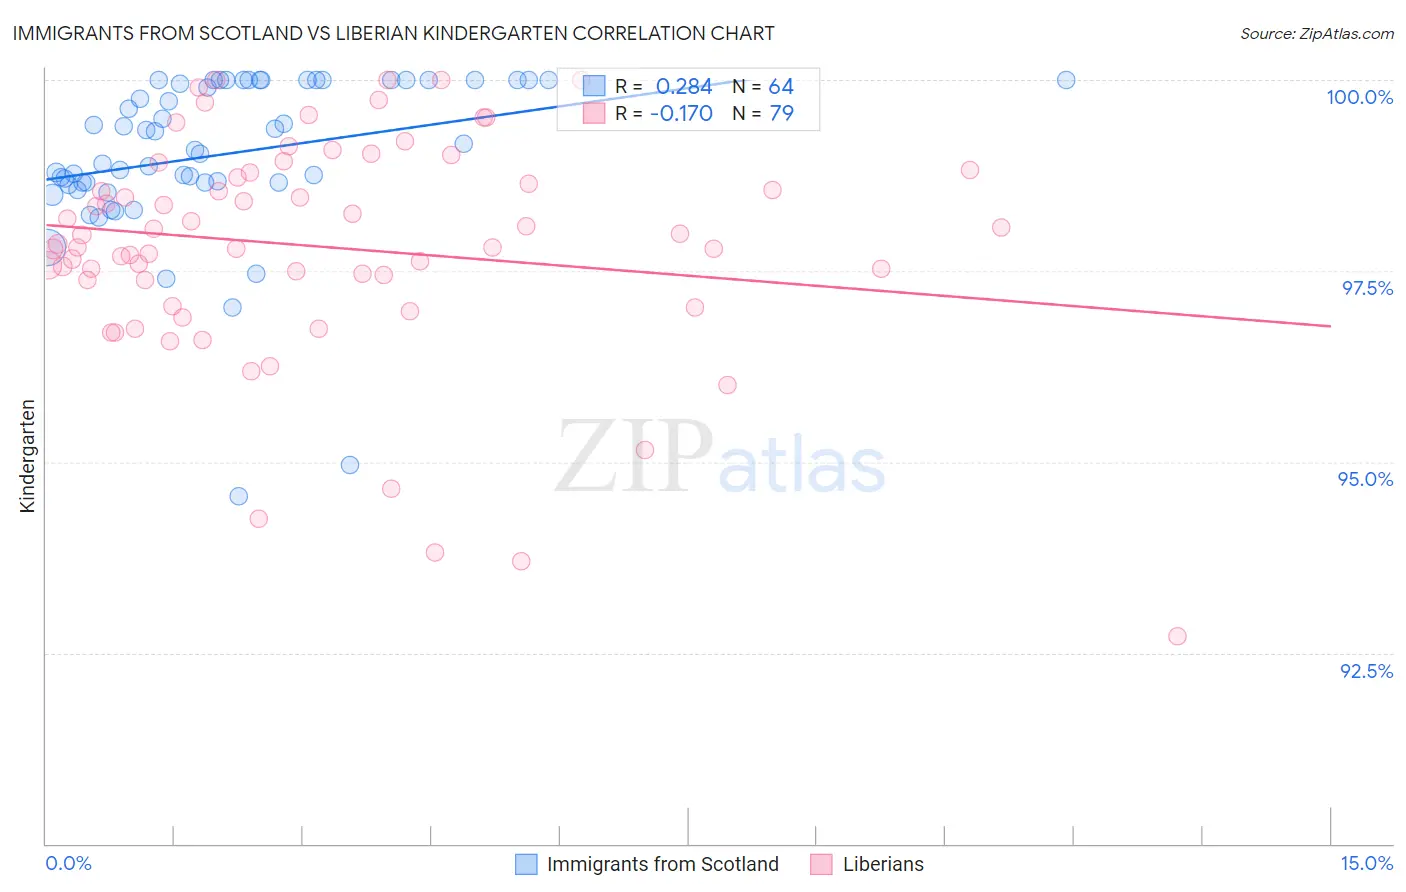
Immigrants from Scotland vs Liberian Kindergarten Correlation Chart
The statistical analysis conducted on geographies consisting of 196,398,887 people shows a weak positive correlation between the proportion of Immigrants from Scotland and percentage of population with at least kindergarten education in the United States with a correlation coefficient (R) of 0.284 and weighted average of 98.4%. Similarly, the statistical analysis conducted on geographies consisting of 118,100,194 people shows a poor negative correlation between the proportion of Liberians and percentage of population with at least kindergarten education in the United States with a correlation coefficient (R) of -0.170 and weighted average of 97.6%, a difference of 0.81%.
Kindergarten Correlation Summary
| Measurement | Immigrants from Scotland | Liberian |
| Minimum | 94.6% | 92.7% |
| Maximum | 100.0% | 100.0% |
| Range | 5.4% | 7.3% |
| Mean | 99.0% | 97.8% |
| Median | 99.1% | 97.9% |
| Interquartile 25% (IQ1) | 98.7% | 97.4% |
| Interquartile 75% (IQ3) | 100.0% | 98.8% |
| Interquartile Range (IQR) | 1.3% | 1.4% |
| Standard Deviation (Sample) | 1.1% | 1.5% |
| Standard Deviation (Population) | 1.1% | 1.5% |
Similar Demographics by Kindergarten
Demographics Similar to Immigrants from Scotland by Kindergarten
In terms of kindergarten, the demographic groups most similar to Immigrants from Scotland are Estonian (98.4%, a difference of 0.010%), Australian (98.4%, a difference of 0.010%), Celtic (98.4%, a difference of 0.010%), Pueblo (98.4%, a difference of 0.010%), and American (98.4%, a difference of 0.010%).
| Demographics | Rating | Rank | Kindergarten |
| Ottawa | 99.8 /100 | #48 | Exceptional 98.4% |
| Kiowa | 99.8 /100 | #49 | Exceptional 98.4% |
| Whites/Caucasians | 99.8 /100 | #50 | Exceptional 98.4% |
| Estonians | 99.8 /100 | #51 | Exceptional 98.4% |
| Australians | 99.8 /100 | #52 | Exceptional 98.4% |
| Celtics | 99.8 /100 | #53 | Exceptional 98.4% |
| Pueblo | 99.8 /100 | #54 | Exceptional 98.4% |
| Immigrants | Scotland | 99.8 /100 | #55 | Exceptional 98.4% |
| Americans | 99.8 /100 | #56 | Exceptional 98.4% |
| Austrians | 99.8 /100 | #57 | Exceptional 98.4% |
| Bulgarians | 99.7 /100 | #58 | Exceptional 98.4% |
| Immigrants | Canada | 99.7 /100 | #59 | Exceptional 98.4% |
| Creek | 99.7 /100 | #60 | Exceptional 98.4% |
| Slavs | 99.7 /100 | #61 | Exceptional 98.4% |
| New Zealanders | 99.7 /100 | #62 | Exceptional 98.4% |
Demographics Similar to Liberians by Kindergarten
In terms of kindergarten, the demographic groups most similar to Liberians are Immigrants from Indonesia (97.6%, a difference of 0.0%), Asian (97.6%, a difference of 0.010%), Bolivian (97.6%, a difference of 0.010%), South American (97.6%, a difference of 0.010%), and Immigrants from Eastern Asia (97.6%, a difference of 0.020%).
| Demographics | Rating | Rank | Kindergarten |
| Immigrants | Malaysia | 2.2 /100 | #234 | Tragic 97.7% |
| Colombians | 2.2 /100 | #235 | Tragic 97.7% |
| Immigrants | Western Asia | 2.1 /100 | #236 | Tragic 97.7% |
| Nigerians | 1.8 /100 | #237 | Tragic 97.6% |
| Immigrants | Eastern Asia | 1.7 /100 | #238 | Tragic 97.6% |
| U.S. Virgin Islanders | 1.7 /100 | #239 | Tragic 97.6% |
| Koreans | 1.6 /100 | #240 | Tragic 97.6% |
| Liberians | 1.3 /100 | #241 | Tragic 97.6% |
| Immigrants | Indonesia | 1.3 /100 | #242 | Tragic 97.6% |
| Asians | 1.2 /100 | #243 | Tragic 97.6% |
| Bolivians | 1.2 /100 | #244 | Tragic 97.6% |
| South Americans | 1.1 /100 | #245 | Tragic 97.6% |
| Indians (Asian) | 1.0 /100 | #246 | Tragic 97.6% |
| Immigrants | Eastern Africa | 1.0 /100 | #247 | Tragic 97.6% |
| Immigrants | Middle Africa | 1.0 /100 | #248 | Tragic 97.6% |