Immigrants from Scotland vs Hawaiian Kindergarten
COMPARE
Immigrants from Scotland
Hawaiian
Kindergarten
Kindergarten Comparison
Immigrants from Scotland
Hawaiians
98.4%
KINDERGARTEN
99.8/ 100
METRIC RATING
55th/ 347
METRIC RANK
97.9%
KINDERGARTEN
29.3/ 100
METRIC RATING
194th/ 347
METRIC RANK
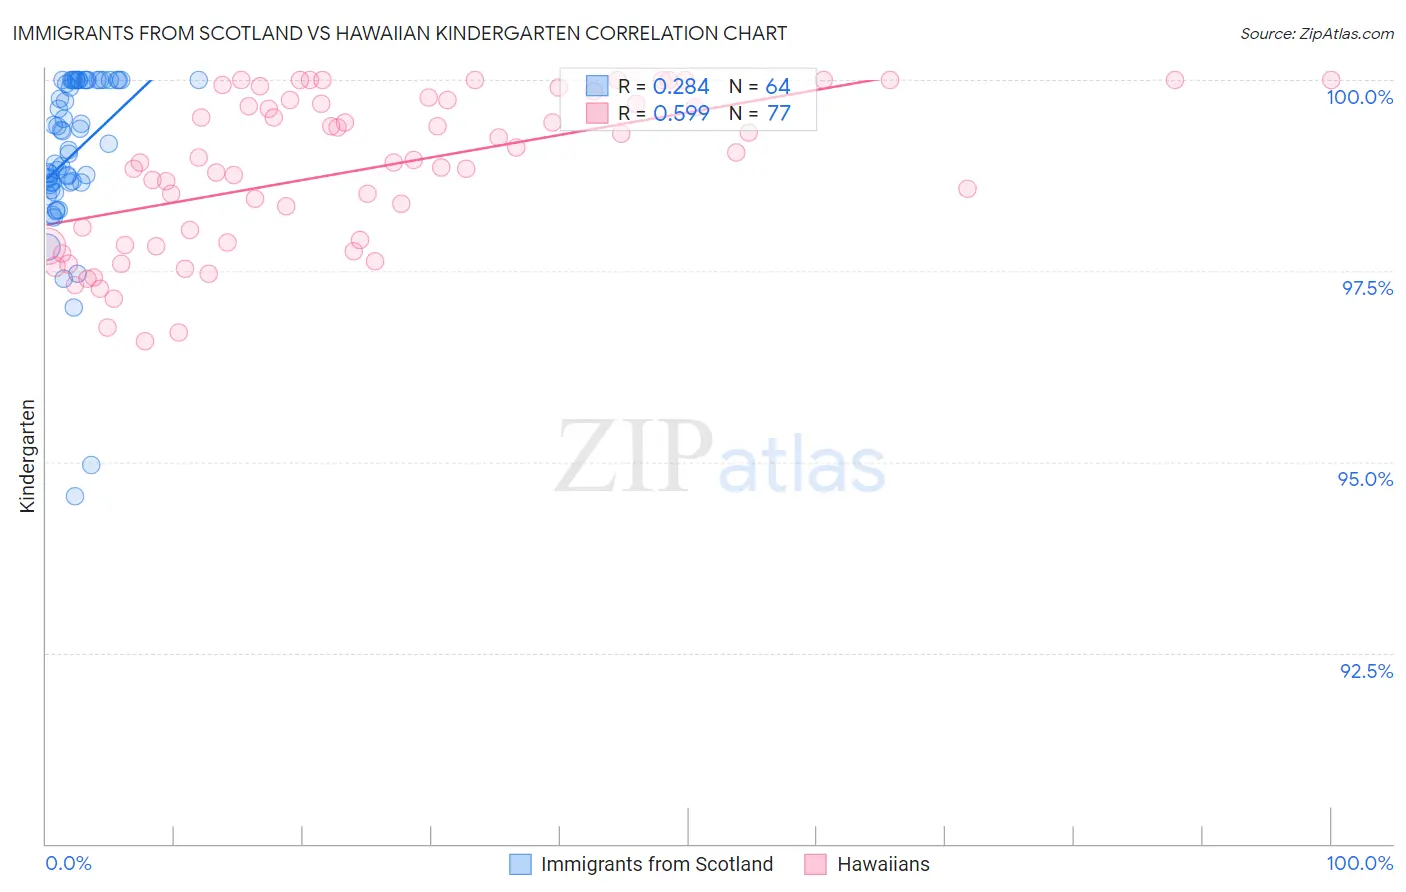
Immigrants from Scotland vs Hawaiian Kindergarten Correlation Chart
The statistical analysis conducted on geographies consisting of 196,398,887 people shows a weak positive correlation between the proportion of Immigrants from Scotland and percentage of population with at least kindergarten education in the United States with a correlation coefficient (R) of 0.284 and weighted average of 98.4%. Similarly, the statistical analysis conducted on geographies consisting of 327,621,279 people shows a substantial positive correlation between the proportion of Hawaiians and percentage of population with at least kindergarten education in the United States with a correlation coefficient (R) of 0.599 and weighted average of 97.9%, a difference of 0.54%.
Kindergarten Correlation Summary
| Measurement | Immigrants from Scotland | Hawaiian |
| Minimum | 94.6% | 96.6% |
| Maximum | 100.0% | 100.0% |
| Range | 5.4% | 3.4% |
| Mean | 99.0% | 98.8% |
| Median | 99.1% | 99.0% |
| Interquartile 25% (IQ1) | 98.7% | 97.9% |
| Interquartile 75% (IQ3) | 100.0% | 99.7% |
| Interquartile Range (IQR) | 1.3% | 1.9% |
| Standard Deviation (Sample) | 1.1% | 1.0% |
| Standard Deviation (Population) | 1.1% | 1.00% |
Similar Demographics by Kindergarten
Demographics Similar to Immigrants from Scotland by Kindergarten
In terms of kindergarten, the demographic groups most similar to Immigrants from Scotland are Estonian (98.4%, a difference of 0.010%), Australian (98.4%, a difference of 0.010%), Celtic (98.4%, a difference of 0.010%), Pueblo (98.4%, a difference of 0.010%), and American (98.4%, a difference of 0.010%).
| Demographics | Rating | Rank | Kindergarten |
| Ottawa | 99.8 /100 | #48 | Exceptional 98.4% |
| Kiowa | 99.8 /100 | #49 | Exceptional 98.4% |
| Whites/Caucasians | 99.8 /100 | #50 | Exceptional 98.4% |
| Estonians | 99.8 /100 | #51 | Exceptional 98.4% |
| Australians | 99.8 /100 | #52 | Exceptional 98.4% |
| Celtics | 99.8 /100 | #53 | Exceptional 98.4% |
| Pueblo | 99.8 /100 | #54 | Exceptional 98.4% |
| Immigrants | Scotland | 99.8 /100 | #55 | Exceptional 98.4% |
| Americans | 99.8 /100 | #56 | Exceptional 98.4% |
| Austrians | 99.8 /100 | #57 | Exceptional 98.4% |
| Bulgarians | 99.7 /100 | #58 | Exceptional 98.4% |
| Immigrants | Canada | 99.7 /100 | #59 | Exceptional 98.4% |
| Creek | 99.7 /100 | #60 | Exceptional 98.4% |
| Slavs | 99.7 /100 | #61 | Exceptional 98.4% |
| New Zealanders | 99.7 /100 | #62 | Exceptional 98.4% |
Demographics Similar to Hawaiians by Kindergarten
In terms of kindergarten, the demographic groups most similar to Hawaiians are Black/African American (97.9%, a difference of 0.0%), Paraguayan (97.9%, a difference of 0.0%), Mongolian (97.9%, a difference of 0.0%), Panamanian (97.9%, a difference of 0.010%), and Immigrants from Taiwan (97.9%, a difference of 0.010%).
| Demographics | Rating | Rank | Kindergarten |
| Immigrants | Kazakhstan | 35.9 /100 | #187 | Fair 97.9% |
| Arabs | 35.4 /100 | #188 | Fair 97.9% |
| Paiute | 34.7 /100 | #189 | Fair 97.9% |
| Panamanians | 33.3 /100 | #190 | Fair 97.9% |
| Immigrants | Taiwan | 30.7 /100 | #191 | Fair 97.9% |
| Blacks/African Americans | 29.9 /100 | #192 | Fair 97.9% |
| Paraguayans | 29.6 /100 | #193 | Fair 97.9% |
| Hawaiians | 29.3 /100 | #194 | Fair 97.9% |
| Mongolians | 28.9 /100 | #195 | Fair 97.9% |
| Guamanians/Chamorros | 26.2 /100 | #196 | Fair 97.9% |
| Immigrants | Kenya | 25.5 /100 | #197 | Fair 97.9% |
| Tohono O'odham | 24.6 /100 | #198 | Fair 97.9% |
| Immigrants | Egypt | 22.3 /100 | #199 | Fair 97.9% |
| Yuman | 21.6 /100 | #200 | Fair 97.9% |
| Immigrants | Lebanon | 20.9 /100 | #201 | Fair 97.9% |