Arab vs Puerto Rican 9th Grade
COMPARE
Arab
Puerto Rican
9th Grade
9th Grade Comparison
Arabs
Puerto Ricans
95.1%
9TH GRADE
74.9/ 100
METRIC RATING
154th/ 347
METRIC RANK
91.8%
9TH GRADE
0.0/ 100
METRIC RATING
323rd/ 347
METRIC RANK
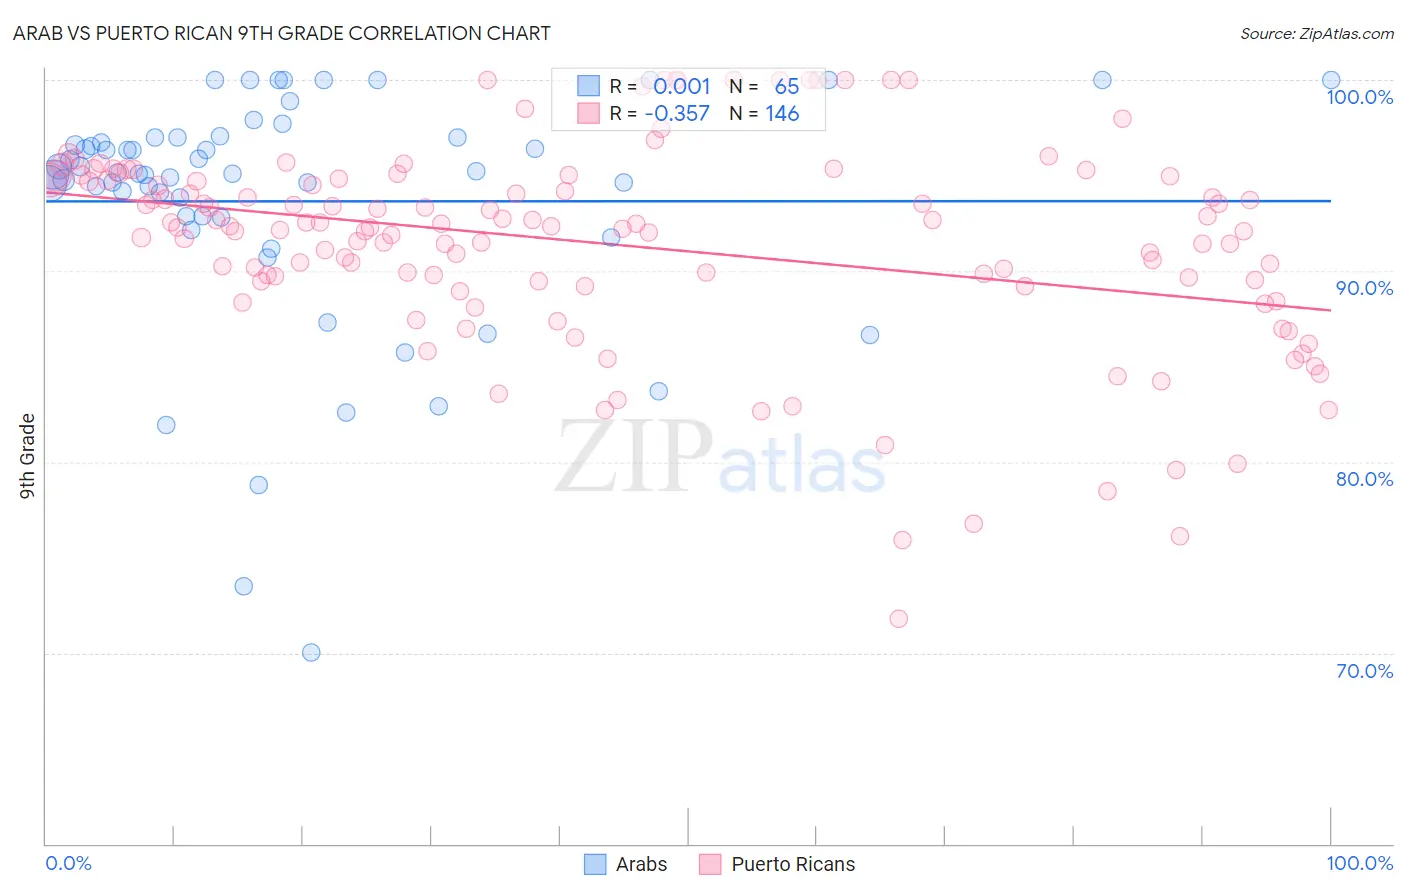
Arab vs Puerto Rican 9th Grade Correlation Chart
The statistical analysis conducted on geographies consisting of 486,871,007 people shows no correlation between the proportion of Arabs and percentage of population with at least 9th grade education in the United States with a correlation coefficient (R) of 0.001 and weighted average of 95.1%. Similarly, the statistical analysis conducted on geographies consisting of 528,320,060 people shows a mild negative correlation between the proportion of Puerto Ricans and percentage of population with at least 9th grade education in the United States with a correlation coefficient (R) of -0.357 and weighted average of 91.8%, a difference of 3.5%.
9th Grade Correlation Summary
| Measurement | Arab | Puerto Rican |
| Minimum | 70.0% | 71.8% |
| Maximum | 100.0% | 100.0% |
| Range | 30.0% | 28.2% |
| Mean | 93.6% | 91.4% |
| Median | 95.1% | 92.3% |
| Interquartile 25% (IQ1) | 92.8% | 89.5% |
| Interquartile 75% (IQ3) | 97.0% | 94.8% |
| Interquartile Range (IQR) | 4.2% | 5.3% |
| Standard Deviation (Sample) | 6.3% | 5.3% |
| Standard Deviation (Population) | 6.2% | 5.3% |
Similar Demographics by 9th Grade
Demographics Similar to Arabs by 9th Grade
In terms of 9th grade, the demographic groups most similar to Arabs are Immigrants from Kazakhstan (95.1%, a difference of 0.0%), Albanian (95.1%, a difference of 0.010%), Ugandan (95.1%, a difference of 0.020%), Immigrants from Kenya (95.0%, a difference of 0.020%), and Mongolian (95.0%, a difference of 0.020%).
| Demographics | Rating | Rank | 9th Grade |
| Choctaw | 81.9 /100 | #147 | Excellent 95.1% |
| Immigrants | Jordan | 81.2 /100 | #148 | Excellent 95.1% |
| Immigrants | Korea | 79.6 /100 | #149 | Good 95.1% |
| Kenyans | 79.1 /100 | #150 | Good 95.1% |
| Cajuns | 77.3 /100 | #151 | Good 95.1% |
| Ugandans | 77.0 /100 | #152 | Good 95.1% |
| Albanians | 76.1 /100 | #153 | Good 95.1% |
| Arabs | 74.9 /100 | #154 | Good 95.1% |
| Immigrants | Kazakhstan | 74.7 /100 | #155 | Good 95.1% |
| Immigrants | Kenya | 73.1 /100 | #156 | Good 95.0% |
| Mongolians | 73.0 /100 | #157 | Good 95.0% |
| Egyptians | 70.1 /100 | #158 | Good 95.0% |
| Immigrants | Ukraine | 67.4 /100 | #159 | Good 95.0% |
| Immigrants | Italy | 66.6 /100 | #160 | Good 95.0% |
| French American Indians | 66.5 /100 | #161 | Good 95.0% |
Demographics Similar to Puerto Ricans by 9th Grade
In terms of 9th grade, the demographic groups most similar to Puerto Ricans are Belizean (91.8%, a difference of 0.0%), Immigrants from Ecuador (91.8%, a difference of 0.030%), Immigrants from Belize (91.8%, a difference of 0.060%), Nicaraguan (91.9%, a difference of 0.090%), and Ecuadorian (91.9%, a difference of 0.14%).
| Demographics | Rating | Rank | 9th Grade |
| Cape Verdeans | 0.0 /100 | #316 | Tragic 92.2% |
| Immigrants | Cuba | 0.0 /100 | #317 | Tragic 92.2% |
| Nepalese | 0.0 /100 | #318 | Tragic 92.0% |
| Ecuadorians | 0.0 /100 | #319 | Tragic 91.9% |
| Nicaraguans | 0.0 /100 | #320 | Tragic 91.9% |
| Immigrants | Ecuador | 0.0 /100 | #321 | Tragic 91.8% |
| Belizeans | 0.0 /100 | #322 | Tragic 91.8% |
| Puerto Ricans | 0.0 /100 | #323 | Tragic 91.8% |
| Immigrants | Belize | 0.0 /100 | #324 | Tragic 91.8% |
| Central American Indians | 0.0 /100 | #325 | Tragic 91.5% |
| Immigrants | Armenia | 0.0 /100 | #326 | Tragic 91.4% |
| Immigrants | Nicaragua | 0.0 /100 | #327 | Tragic 91.3% |
| Dominicans | 0.0 /100 | #328 | Tragic 91.1% |
| Hondurans | 0.0 /100 | #329 | Tragic 91.0% |
| Immigrants | Cabo Verde | 0.0 /100 | #330 | Tragic 90.9% |