Immigrants from Russia vs Black/African American No Schooling Completed
COMPARE
Immigrants from Russia
Black/African American
No Schooling Completed
No Schooling Completed Comparison
Immigrants from Russia
Blacks/African Americans
2.0%
NO SCHOOLING COMPLETED
67.6/ 100
METRIC RATING
155th/ 347
METRIC RANK
2.1%
NO SCHOOLING COMPLETED
41.4/ 100
METRIC RATING
183rd/ 347
METRIC RANK
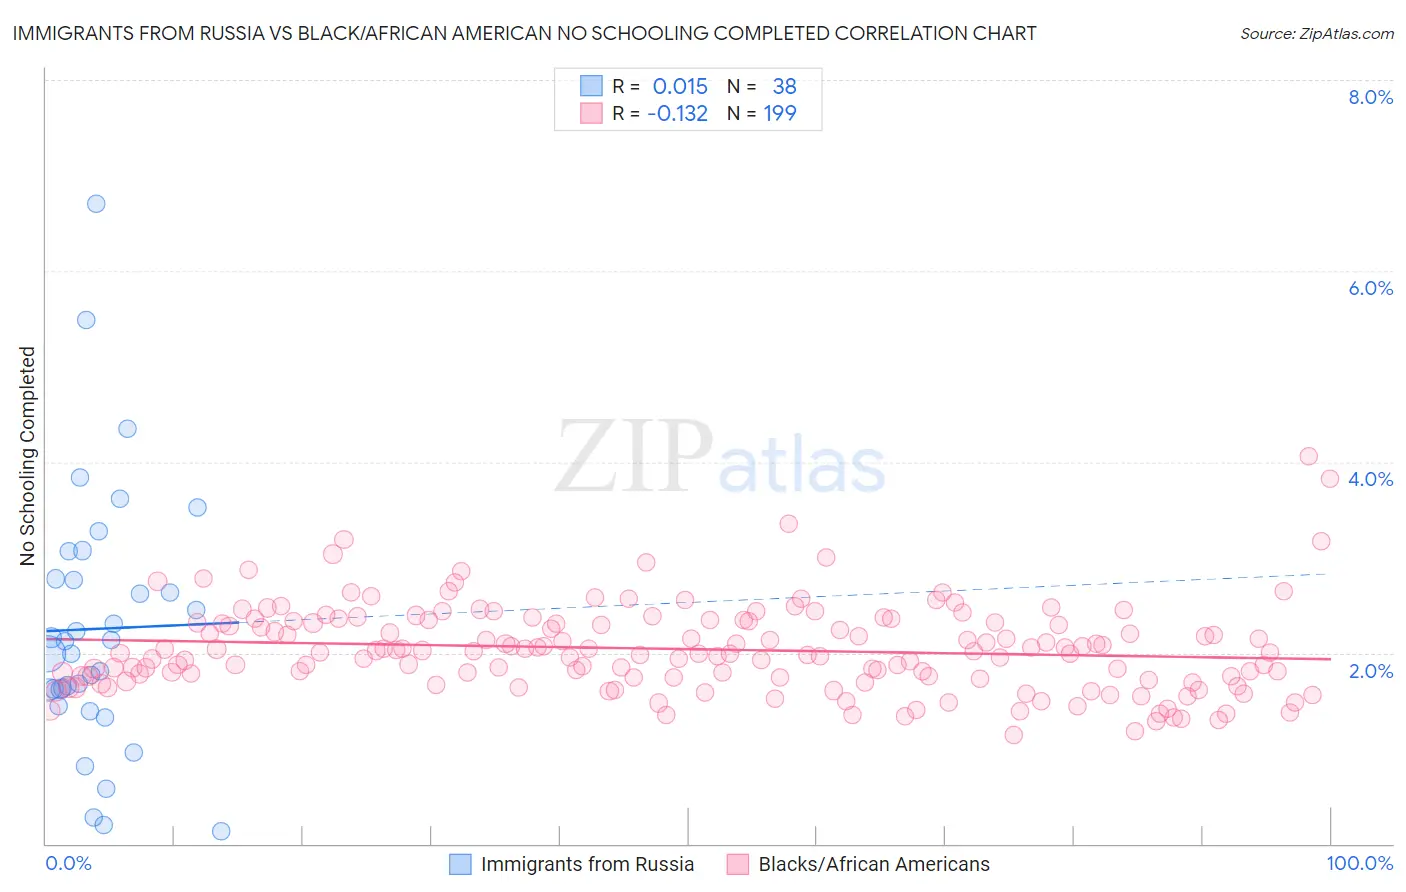
Immigrants from Russia vs Black/African American No Schooling Completed Correlation Chart
The statistical analysis conducted on geographies consisting of 344,183,318 people shows no correlation between the proportion of Immigrants from Russia and percentage of population with no schooling in the United States with a correlation coefficient (R) of 0.015 and weighted average of 2.0%. Similarly, the statistical analysis conducted on geographies consisting of 551,024,391 people shows a poor negative correlation between the proportion of Blacks/African Americans and percentage of population with no schooling in the United States with a correlation coefficient (R) of -0.132 and weighted average of 2.1%, a difference of 3.7%.
No Schooling Completed Correlation Summary
| Measurement | Immigrants from Russia | Black/African American |
| Minimum | 0.13% | 1.1% |
| Maximum | 6.7% | 4.1% |
| Range | 6.6% | 2.9% |
| Mean | 2.3% | 2.0% |
| Median | 2.1% | 2.0% |
| Interquartile 25% (IQ1) | 1.6% | 1.7% |
| Interquartile 75% (IQ3) | 2.8% | 2.3% |
| Interquartile Range (IQR) | 1.2% | 0.59% |
| Standard Deviation (Sample) | 1.4% | 0.46% |
| Standard Deviation (Population) | 1.3% | 0.46% |
Similar Demographics by No Schooling Completed
Demographics Similar to Immigrants from Russia by No Schooling Completed
In terms of no schooling completed, the demographic groups most similar to Immigrants from Russia are Chilean (2.0%, a difference of 0.070%), Immigrants from Sri Lanka (2.0%, a difference of 0.10%), Immigrants from Venezuela (2.0%, a difference of 0.14%), Immigrants from Korea (2.0%, a difference of 0.14%), and Immigrants from Spain (2.0%, a difference of 0.19%).
| Demographics | Rating | Rank | No Schooling Completed |
| Shoshone | 76.7 /100 | #148 | Good 2.0% |
| Immigrants | North Macedonia | 75.9 /100 | #149 | Good 2.0% |
| Blackfeet | 72.9 /100 | #150 | Good 2.0% |
| Immigrants | Jordan | 70.9 /100 | #151 | Good 2.0% |
| Immigrants | Eastern Europe | 70.4 /100 | #152 | Good 2.0% |
| Immigrants | Italy | 68.9 /100 | #153 | Good 2.0% |
| Immigrants | Venezuela | 68.5 /100 | #154 | Good 2.0% |
| Immigrants | Russia | 67.6 /100 | #155 | Good 2.0% |
| Chileans | 67.2 /100 | #156 | Good 2.0% |
| Immigrants | Sri Lanka | 67.0 /100 | #157 | Good 2.0% |
| Immigrants | Korea | 66.7 /100 | #158 | Good 2.0% |
| Immigrants | Spain | 66.4 /100 | #159 | Good 2.0% |
| Kenyans | 65.7 /100 | #160 | Good 2.0% |
| Ugandans | 64.6 /100 | #161 | Good 2.0% |
| Immigrants | Brazil | 63.8 /100 | #162 | Good 2.1% |
Demographics Similar to Blacks/African Americans by No Schooling Completed
In terms of no schooling completed, the demographic groups most similar to Blacks/African Americans are Pima (2.1%, a difference of 0.020%), Mongolian (2.1%, a difference of 0.090%), French American Indian (2.1%, a difference of 0.10%), Immigrants from Taiwan (2.1%, a difference of 0.15%), and Portuguese (2.1%, a difference of 0.33%).
| Demographics | Rating | Rank | No Schooling Completed |
| Panamanians | 45.2 /100 | #176 | Average 2.1% |
| Arapaho | 45.0 /100 | #177 | Average 2.1% |
| Pakistanis | 44.7 /100 | #178 | Average 2.1% |
| Immigrants | Kazakhstan | 44.3 /100 | #179 | Average 2.1% |
| Portuguese | 43.9 /100 | #180 | Average 2.1% |
| Immigrants | Taiwan | 42.6 /100 | #181 | Average 2.1% |
| French American Indians | 42.2 /100 | #182 | Average 2.1% |
| Blacks/African Americans | 41.4 /100 | #183 | Average 2.1% |
| Pima | 41.3 /100 | #184 | Average 2.1% |
| Mongolians | 40.8 /100 | #185 | Average 2.1% |
| Immigrants | Bosnia and Herzegovina | 38.6 /100 | #186 | Fair 2.1% |
| Navajo | 36.5 /100 | #187 | Fair 2.1% |
| Immigrants | Kenya | 36.2 /100 | #188 | Fair 2.1% |
| Immigrants | Egypt | 36.1 /100 | #189 | Fair 2.1% |
| Spanish Americans | 32.6 /100 | #190 | Fair 2.1% |